
 Home
Home News
News
- 1 DOT price showed a range breakout and reached $6.00.
- 2 Buyers have gained momentum and showed their dominance.
Polkadot is a multichain blockchain platform designed for interoperability in the Web 3.0 era. Its core function is to bridge blockchains, whether private, public, or permissionless, into a cohesive network. Polkadot price climbed above $5.00, exhibiting a massive surge in buying momentum. The project was started by Ethereum [ETH] co-founders Gavin Wood, Peter Czaban, and Robert Habermeier. Wood published the protocol’s white paper in 2016. The price action shows the bulls’ dominance and witnessed buying interest on the chart.
Polkadot price surpassed the psychological mark of $5 and witnessed bullishness on the chart. Moreover, the technicals show that the DOT price has registered a falling wedge breakout, recovered from the bottom mark of $3.60, and surged over 60% in recent weeks.
The live price of DOT crypto is $6.01, with an intraday gain of 7.49%, showing bullishness on the chart. Moreover, the trading volume increased by 4.50% to $381.20 Million. However, the pair of DOT/BTC is at 0.000136 BTC, and the market cap is $7.97 Billion. Analysts have maintained a buy rating and suggest that DOT price may continue to outperform in the following sessions.
DOT on Daily Chart Shows Falling Wedge Breakout
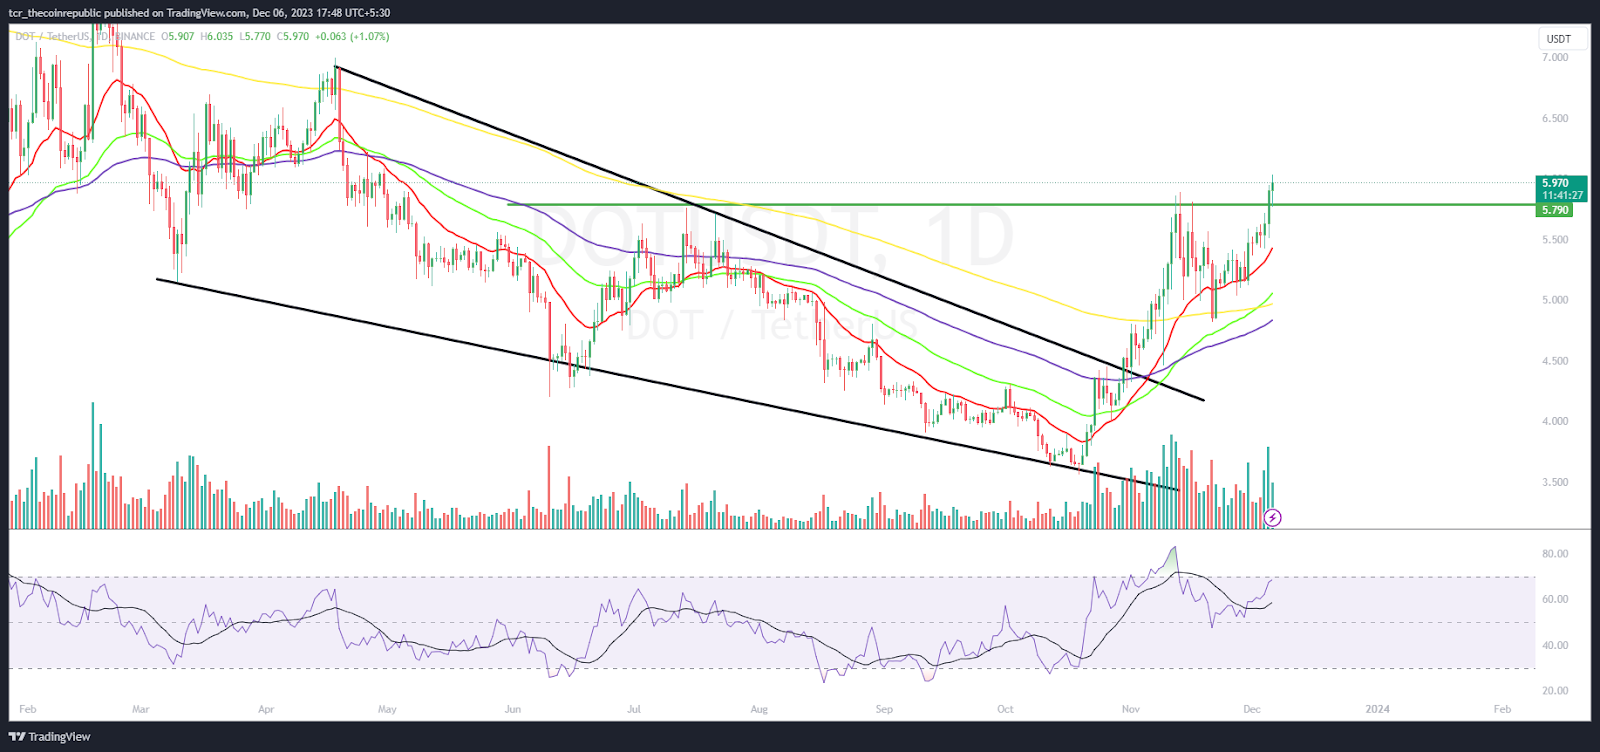
On the daily chart, Polkadot price showed a massive comeback and breached the immediate hurdle of $6.00, witnessing a bullish reversal in recent sessions. The technicals show that DOT crypto is now forming higher highs and escaped the key moving averages that showed bullish dominance.
The RSI curve stayed in the overbought zone and formed a bullish divergence, suggesting a positive outlook for the upcoming sessions.
The MACD indicator showed a bullish crossover and formed green bars on the histogram, suggesting a favorable bullish outlook for the upcoming sessions.
Weekly Charts Show Trendline Breakout
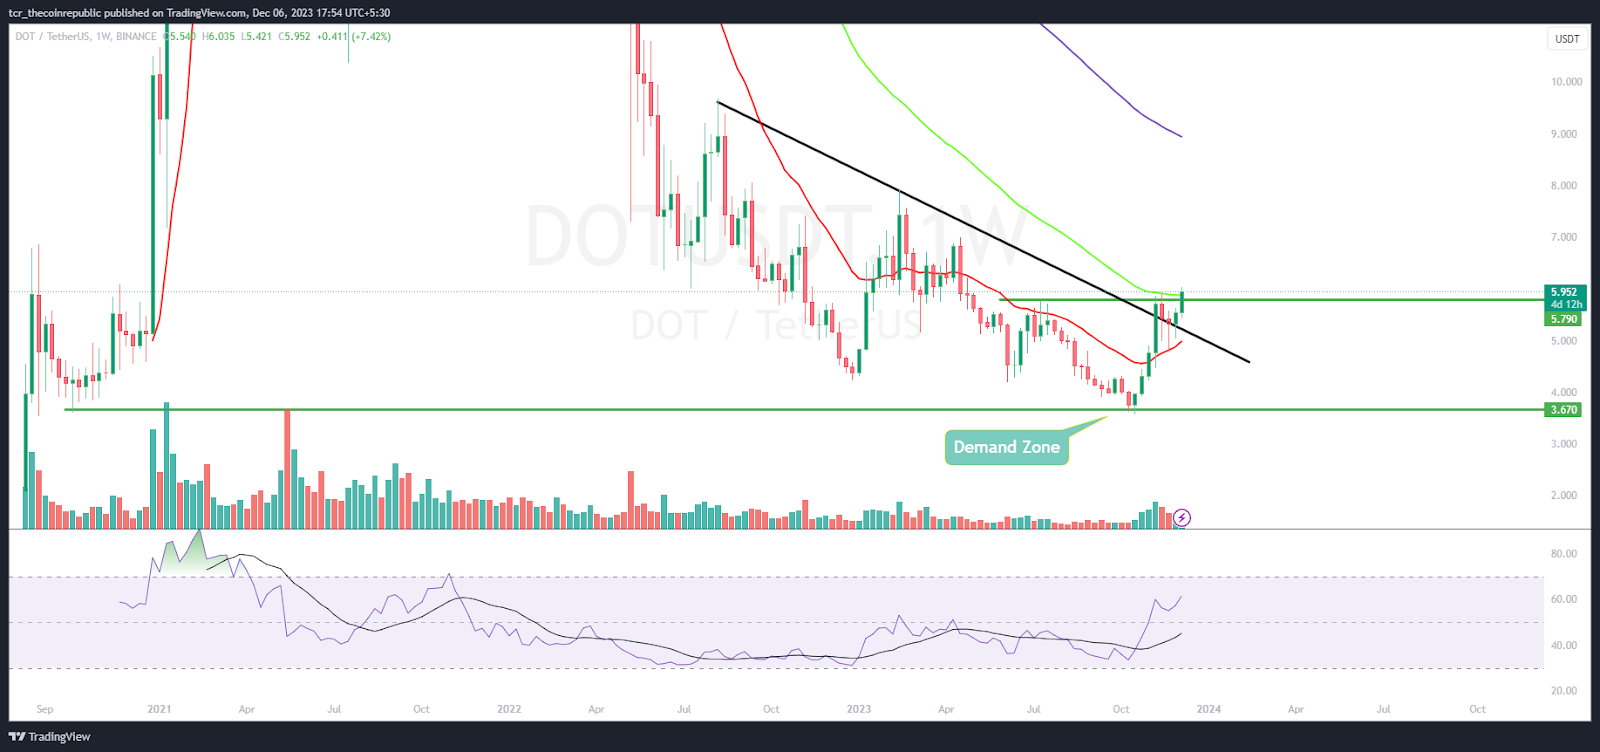
On the weekly chart, Polkadot price broke out of a trendline and now it faces the 50 day EMA barrier. Moreover, the price action produced made lower highs and lower lows and is now in the neutral region. DOT crypto has pulled back from the demand zone and is on track of recovery.
Summary
Polkadot price recovered the gains and retested the 50% Fibonacci retracement zone witnessing bullish momentum on the chart. Moreover, the price action shows a trendline breakout and has gained momentum. Furthermore, the buyers look aggressive and are on track to reach the blue skyzone of $10.00.
Technical Levels
Support Levels: $5.50 and $5.00
Resistance Levels: $6.20 and $7.00
Disclaimer
The views and opinions stated by the author or any other person named in this article are for informational purposes only and do not constitute financial, investment, or other advice. Investing in or trading crypto or stocks comes with a risk of financial loss.

With a background in journalism, Ritika Sharma has worked with many reputed media firms focusing on general news such as politics and crime. She joined The Coin Republic as a reporter for crypto, and found a great passion for cryptocurrency, Web3, NFTs and other digital assets. She spends a lot of time researching and delving deeper into these concepts around the clock, and is a strong advocate for women in STEM.


