
 Home
Home News
News

- 1 EOS price showcased a range breakout and has persisted in extending the gains.
- 2 Buyers are acquiring momentum and are looking to register a breakout.
EOS price recovered from the lows of $0.530 and revealed a range breakout on the chart. Moreover, the EOS crypto has attained momentum and is close to the neckline of $0.800, from where a rejection candle was witnessed. Furthermore, the chart shows the higher highs pattern. Follow on buying interest was noted in the recent sessions.

EOS price has exceeded the significant moving averages and is trading above the neutral region. Furthermore, the price action highlights the bullish dominance over the past number of sessions. The technicals showcased the symmetrical triangle breakout as the price sharply rebounded from the 200-day EMA. Now, EOS price continues to accumulate the gains as it gets closer to the make-or-break zone.

The live price of EOS crypto is $0.7537, with an intraday gain of 2.24%, showing neutrality on the chart. Moreover, the trading volume increased by 22.08% to $206.28 Million. However, the pair of EOS/BTC is at 0.0000176 BTC, and the market cap is $754.89 Million. Analysts have maintained a neutral rating and suggest that EOS crypto will continue to extend the gains in the following sessions.
EOS on Daily Charts Shows Range Breakout
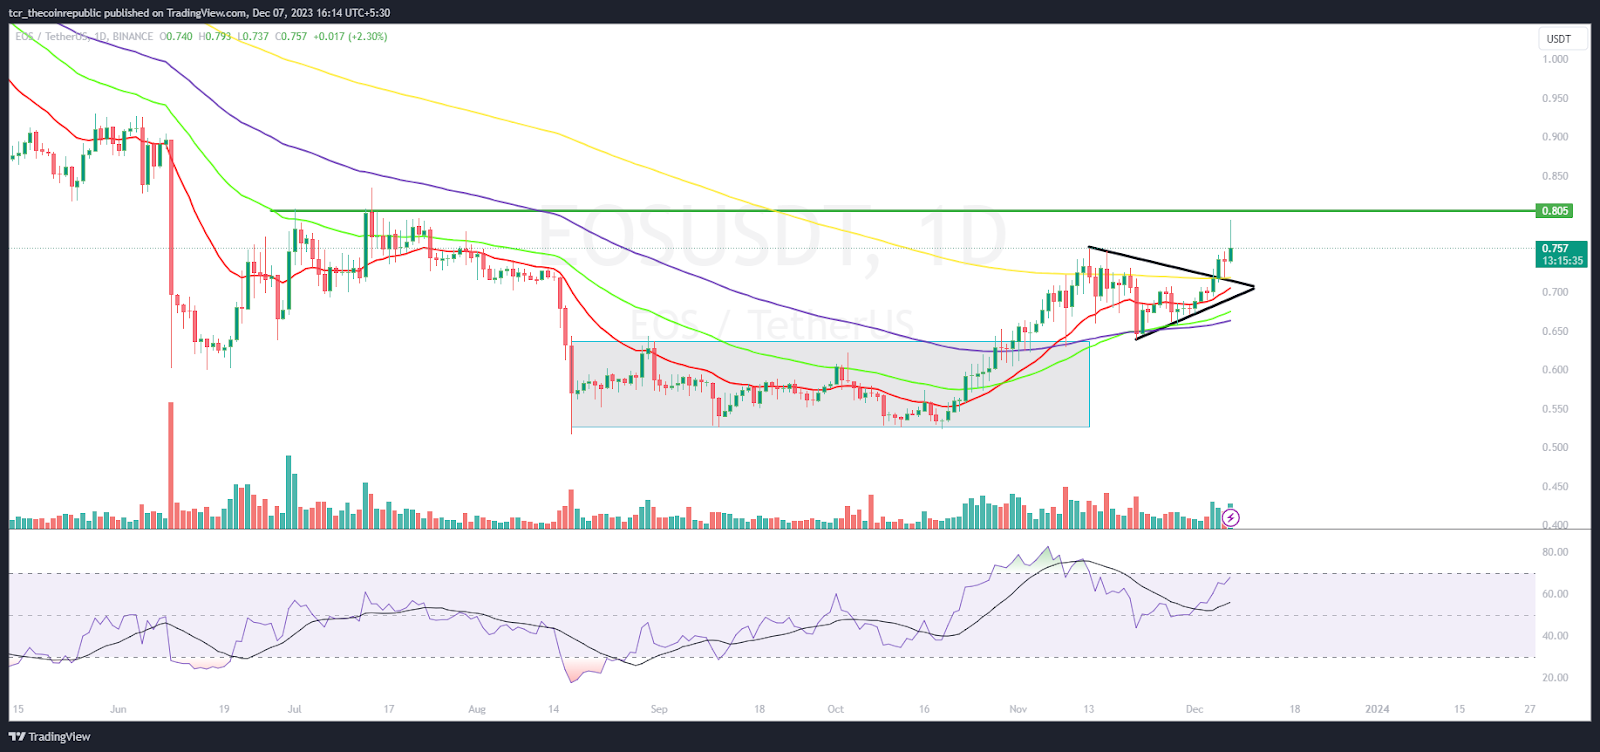
On the daily chart, the EOS price showed a range breakout and has attained fresh buying momentum in recent sessions. Furthermore, the EOS crypto broke the trendline and displayed a pullback from the 200-day EMA mark.
The RSI curve stayed in the overbought zone and formed a positive divergence, confirming a positive outlook on the charts.The MACD indicator showed a bullish crossover and formed green bars on the histogram, emphasizing the bullish bias.
EOS on Weekly Charts Shows Falling Wedge Breakout
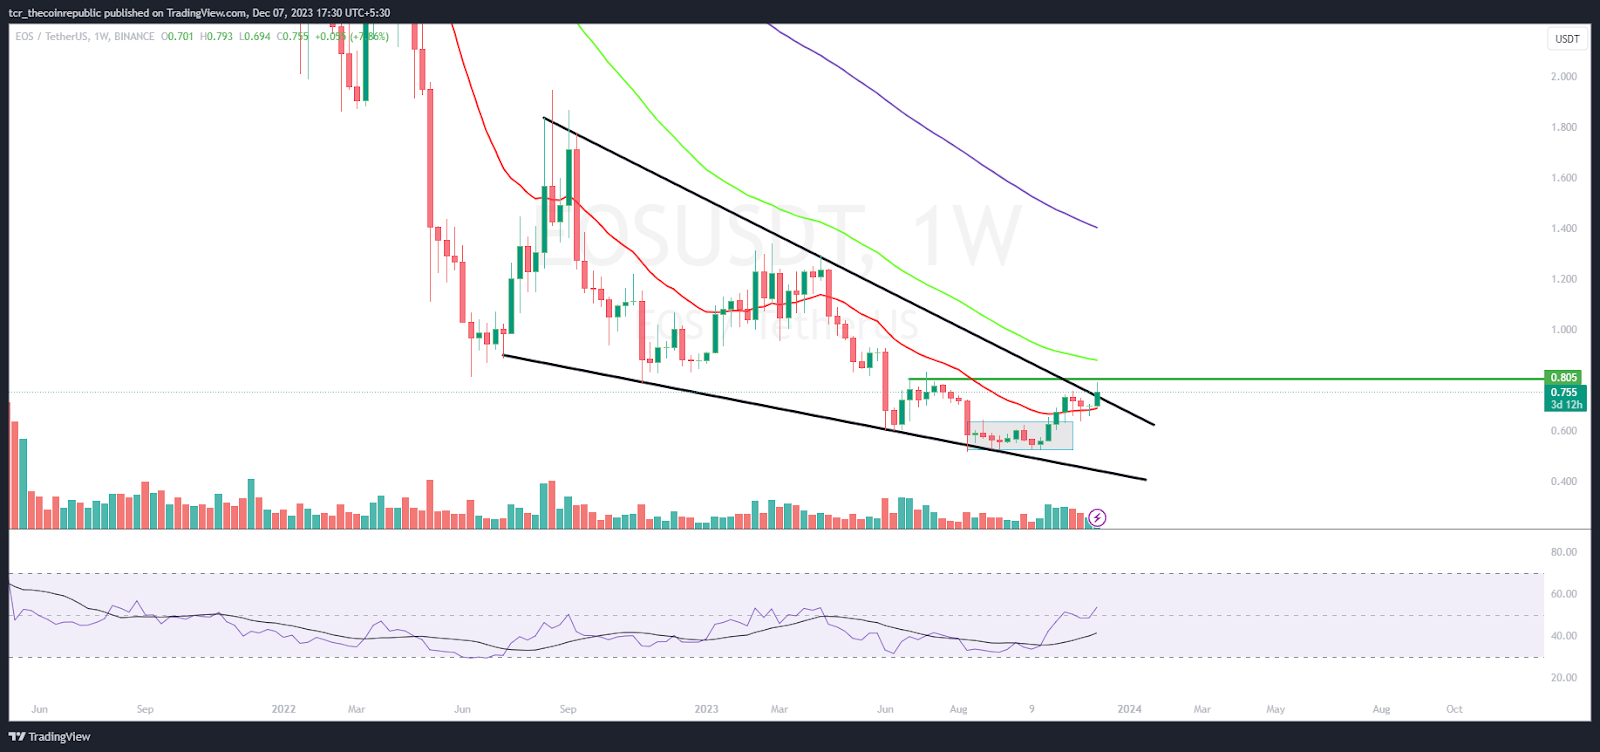
On the weekly chart, EOS price surpassed the upper trendline of the falling wedge pattern and replicated a bullish reversal in the recent sessions. Moreover, the price action displays the buying interest, and buyers are persisted in accumulation. EOS price has approached the bullish zone, climbed above the 50% Fibonacci retracement zone, and surpassed the mid bollinger band.
Summary
EOS price exhibits a reversal and has surpassed the trendline mark of $0.700, displaying a breakout on the charts. Moreover, the buyers are acquiring the momentum and are looking to claim the immediate 50-day EMA mark near $0.800. Both, the RSI and the MACD confirm the bullish trend are giving positive signals for the coming sessins.
Technical Levels
Support Levels: $0.700 and $0.620
Resistance Levels: $0.800 and $0.900
Disclaimer
The views and opinions stated by the author or any other person named in this article are for informational purposes only and do not constitute financial, investment, or other advice. Investing in or trading crypto or stocks comes with a risk of financial loss.

Adarsh Singh is a true connoisseur of Defi and Blockchain technologies, who left his job at a “Big 4” multinational finance firm to pursue crypto and NFT trading full-time. He has a strong background in finance, with MBA from a prestigious B-school. He delves deep into these innovative fields, unraveling their intricacies. Uncovering hidden gems, be it coins, tokens or NFTs, is his expertise. NFTs drive deep interest for him, and his creative analysis of NFTs opens up engaging narratives. He strives to bring decentralized digital assets accessible to the masses.


