
 Home
Home News
News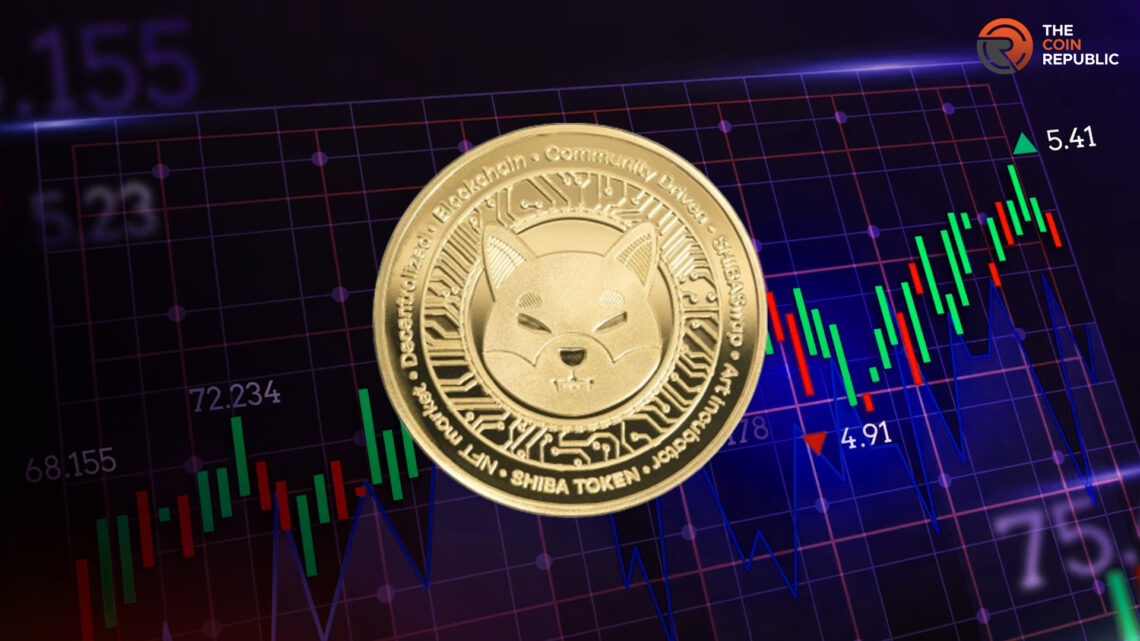
- 1 SHIB price rebounded from the lows of $0.00000660.
- 2 Shiba Inu price is closer to the supply zone and is attempting to register a breakout.
SHIB price rose up from the bottom and claimed the top zone, highlighting the bullish momentum on the chart. Moreover, the SHIB Inu price is closer to the supply zone of $0.00001100, and buyers are attempting to surpass the hurdle. However, the SHIB price surged by over 30% this week, demonstrating massive buyer accumulation.
SHIB Inu price is trading above the key moving averages and is approaching the bullish trajectory that has beaten the sellers grip. Furthermore, the SHIB crypto accelerated over the past few trading sessions and climbed above the foremost hurdle of $0.00001000. Shiba Inu continues to gain prominence, and recent developments boosted SHIB price during the crypto market pump.
From its launch till now, Shibarium has crossed 32M+ transactions, reflecting the growing demand for faster and cheaper transactions within the SHIB ecosystem.
The live price of SHIB crypto is $0.00001036 with an intraday gain of 4.42%, showing bullishness on the chart. Moreover, the trading volume increased by 5.29% to $327.98 Million. However, the pair of SHIB/BTC is at 0.000000000235 BTC, while the market cap rose to $6.12 Billion. Analysts have maintained an outperform rating and suggest an optimistic view per the ongoing bullish trend.
SHIB Price Displays Breakout on Daily Chart
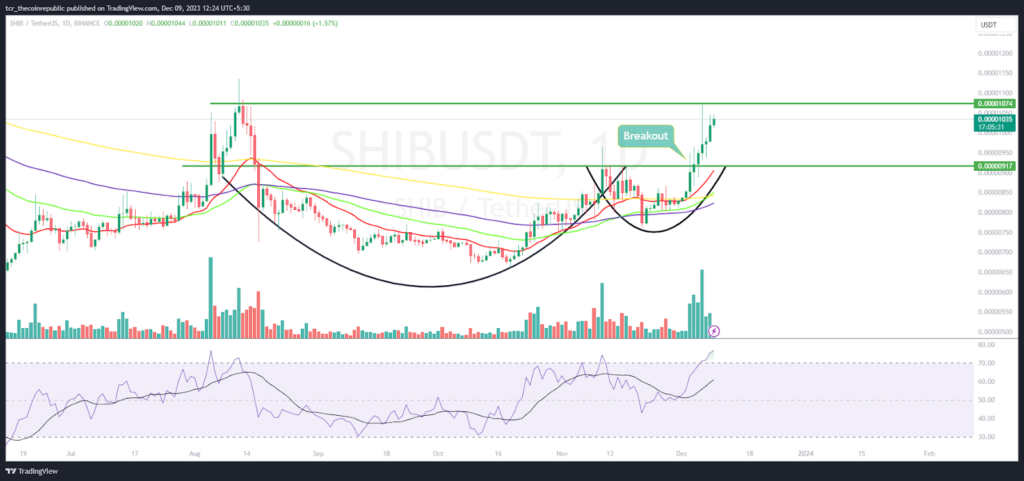
On the daily chart, SHIB inu price surpassed the neckline of $0.00000900 and observed a breakout of the cup and handle pattern. After the escape, SHIB price continued to gain traction and witnessed follow on buying action without looking back.
The RSI curve witnessed a sharp spike and claimed the overbought zone near 75, highlighting intense buying momentum. Additionally, the SHIB inu price is expected to reach the blue sky zone above $0.00001200 in the following sessions.
The MACD indicator observed a bullish crossover and replicated green bars on the histogram, suggesting outperformance for the upcoming sessions.
SHIB Shows Falling Wedge Pattern on Weekly Chart
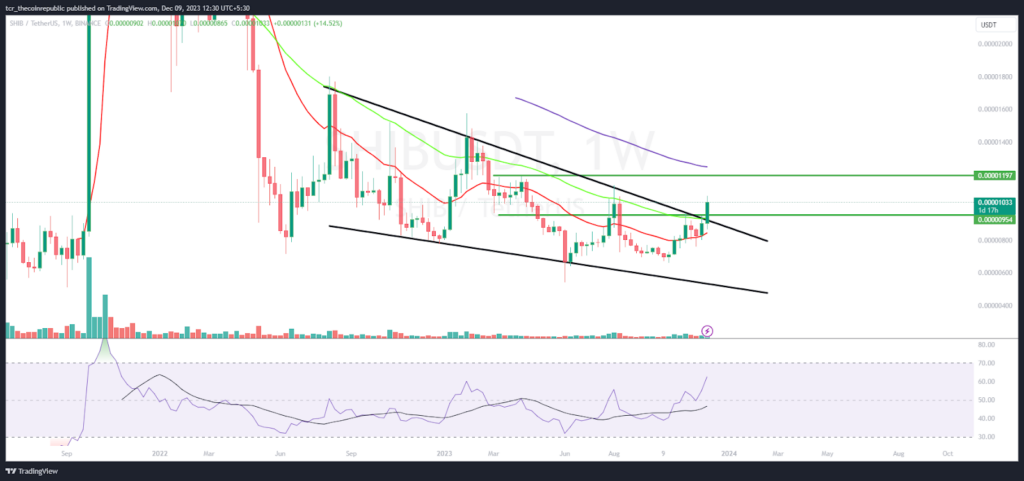
On the weekly chart, SHIB inu price surpassed the trendline of the falling wedge pattern and broke out over the last few sessions. Moreover, a hammer candlestick at the bottom was noted during the retracement, which proved the reversal. Now, buyers have healed their muscles and persisted in accumulating SHIB crypto.
Summary
SHIB price has surpassed the neckline barrier of $0.00000900 and witnessed a massive rally post-breakout in recent sessions. The technicals highlight the bulls’ dominance. The buyers have persisted in expanding the gains and have set their eyes on the immediate spot of $0.00001100.
Technical Levels
Support Levels: $0.00001000 and $0.00000920
Resistance Levels: $0.00001100 and $0.00001260
Disclaimer
The views and opinions stated by the author or any other person named in this article are for informational purposes only and do not constitute financial, investment, or other advice. Investing in or trading crypto or stocks comes with a risk of financial loss.
Steve Anderson is an Australian crypto enthusiast. He is a specialist in management and trading for over 5 years. Steve has worked as a crypto trader, he loves learning about decentralisation, understanding the true potential of the blockchain.


