
 Home
Home News
News

- 1 ETH price showed a rising parallel channel on the charts.
- 2 Buyers are persisted in adding longs and are looking to retest $2500.
Ethereum price witnessed a sharp bull run and persisted in extending the gains inside the rising parallel channel. The second most valuable coin, Ethereum, seems promising now and has energized the gains for the past sessions. The ETH price was in a correction phase for a long time, consolidating below the critical hurdle of $2000. Buyers added their long positions as soon as the Ethereum price escaped the above-mentioned hurdle and desperately led a sharp upward move.

The Ethereum coin price displayed a range breakout above $2000 and is trading in a bullish trajectory. Furthermore, the ETH crypto rides beyond the significant moving averages and exhibits an uptrend on the charts. Per the Fibonacci retracement levels, ETH price has surpassed the 50% zone and is close to the 61.8% zone near $2300. The technicals are favoring the bulls and suggest that the Ethereum price may catch $2500 in the following sessions.

The live price of the Ethereum (ETH) coin is $2245.02, with an intraday drop of 4.45%, showing neutrality on the charts. Moreover, the trading volume increased by 4.81% to $19.73 Billion. However, the pair of ETH/BTC is at 0.0532 BTC, and the market cap is $273.98 Billion. Furthermore, Analysts have maintained a bullish rating and suggest a growth outlook for the upcoming sessions.
Ethereum on Daily Charts Displays Rising Parallel Channel
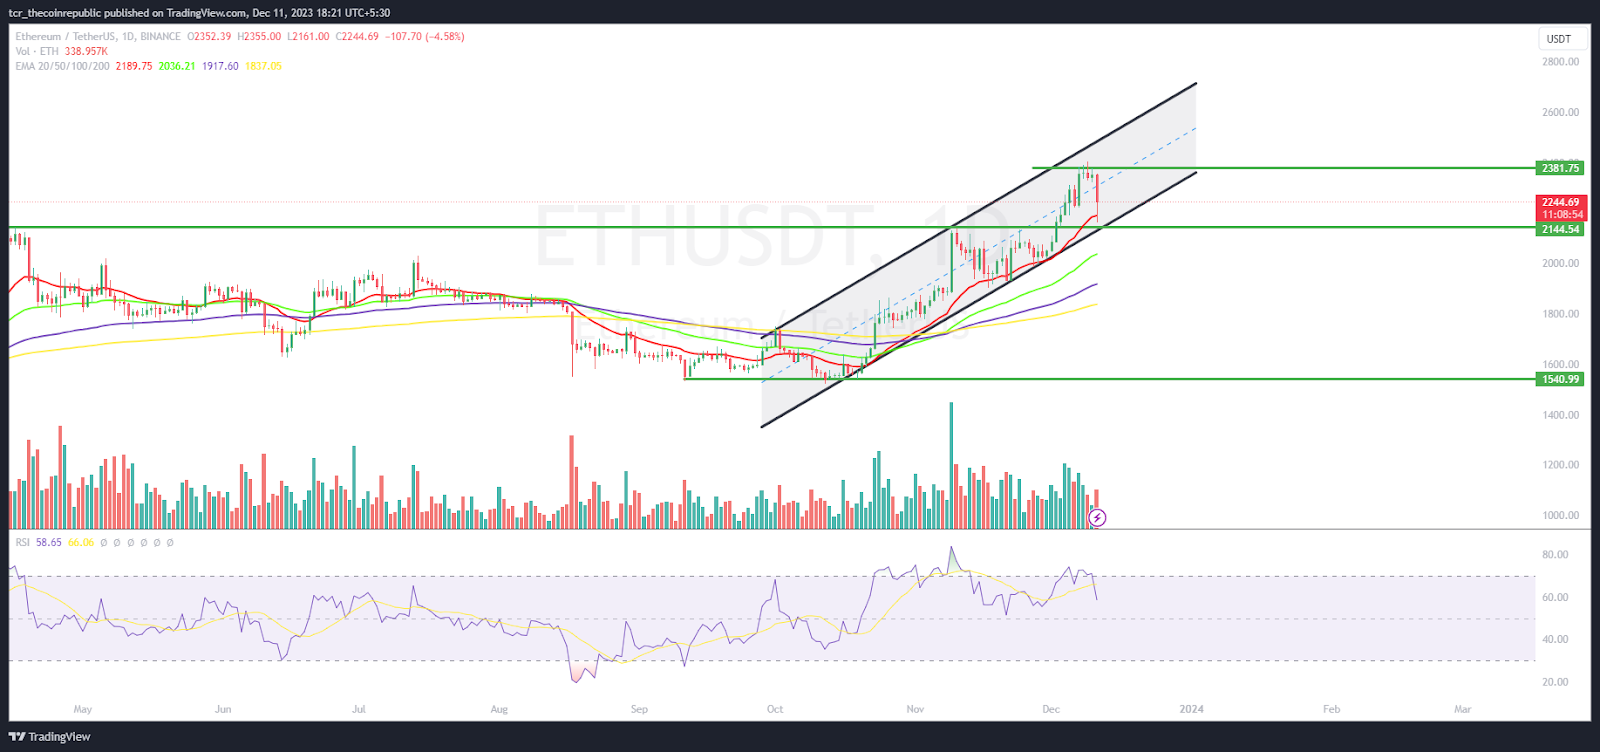
On the daily charts, Ethereum’s price displayed a rising parallel channel and retained the bullish trajectory zone above $2000 in the recent sessions. The price action shows the buyers’ accumulation, and bulls are looking aggressive now. Furthermore, the technicals are replicating the higher highs formation.
The RSI curve stays close to the neutral region and displays a negative divergence on the charts. The MACD indicator showed a bullish crossover and formed green bars on the histogram suggesting the volatile outlook for the upcoming sessions.
Weekly Charts Display Bullish Crossover
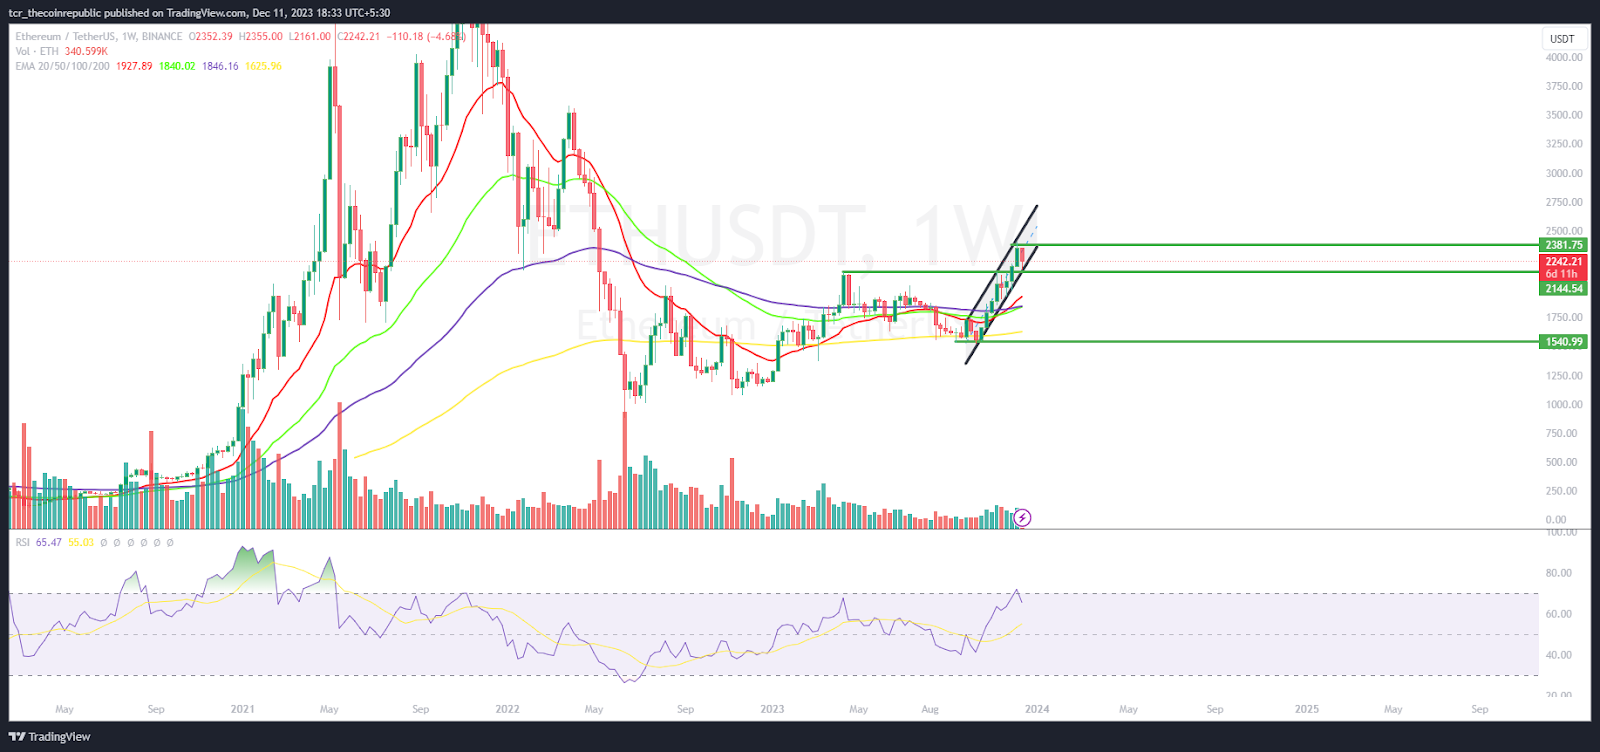
On the weekly charts, Ethereum price has surpassed the key moving averages and replicated a turnaround in the recent sessions. Moreover, the price action shows the bullish crossover and suggests that ETH price may continue to surge and will catch $3000 this month per the ongoing bullish momentum.
Summary
Ethereum price surpassed the swing hurdle of $2000 and replicated the outperformance in the recent sessions. The price action demonstrated the bulls’ dominance and witnessed a trend reversal on the charts. Furthermore, the bulls are looking aggressive, and the ETH price may soon reach $2500.
Technical Levels
Support Levels: $2200 and $2100
Resistance Levels: $2300 and $2500
Disclaimer
The views and opinions stated by the author or any other person named in this article are for informational purposes only and do not constitute financial, investment, or other advice. Investing in or trading crypto or stocks comes with a risk of financial loss.

With a background in journalism, Ritika Sharma has worked with many reputed media firms focusing on general news such as politics and crime. She joined The Coin Republic as a reporter for crypto, and found a great passion for cryptocurrency, Web3, NFTs and other digital assets. She spends a lot of time researching and delving deeper into these concepts around the clock, and is a strong advocate for women in STEM.


