
 Home
Home News
News
- 1 Stellar crypto price has been moving within the horizontal price range of $0.146530 and $0.134468 on the daily time frame chart.
- 2 XLM price is still above the key moving averages showcasing strength in the trend.
- 3 XLMUSD is currently taking support on the 200-Day EMA.
The Stellar price forecast suggests that the trend is not clearly bullish or bearish. Investors may prefer to wait for multiple technical signals to determine trend direction. The green candle is rising slightly, indicating that the XLM price is drawing buyers into the demand zone.
Investor sentiment on the Stellar price is currently uncertain and may remain negative unless buyers step up their activities. However, per the technical indicators and price action, the odds are in favor of the bulls.
The price of the Stellar cryptocurrency will lure buyers toward the upper trend line of the consolidation phase on the daily chart. Meanwhile, the Stellar cryptocurrency price is trying to find support and climb towards $0.134468.
The Stellar cryptocurrency is consolidating with a horizontal price range from $0.146530 to $0.134468. However, the price of Stellar cryptocurrency gained by about 1.98% in one week, but fell by 0.28% in one month. Additionally, the price of the XLM cryptocurrency gained approximately 2.80% over the past three months and approximately 57.22% over the past six months.
Stellar crypto Price is Moving Within the Price Range
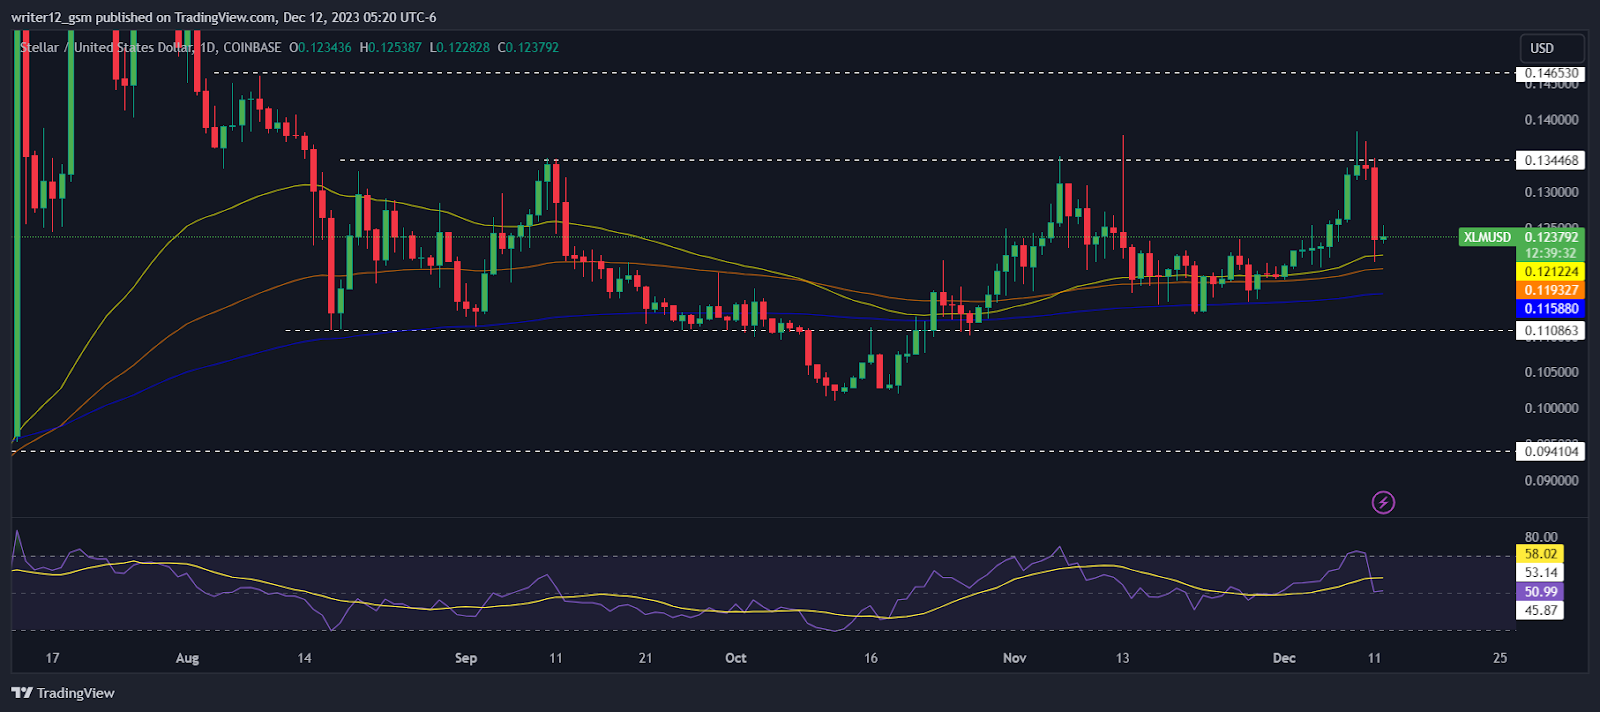
To reach the upper limit of the consolidation phase, the price of the Stellar cryptocurrency must start to rise. However, for the Stellar cryptocurrency to enter the recovery phase, it needs to gather buyers. Meanwhile, the price of Stellar cryptocurrency trading is above the 20-day, 50-day, 100-day, and 200-day moving averages.
Technical indicators indicate a consolidation phase in the price of the Stellar cryptocurrency. The Relative Strength Index (RSI) highlights the sideways momentum of the Stellar cryptocurrency. RSI was at 50 and is moving towards oversold territory.
MACD shows the consolidation phase of the price of Stellar cryptocurrency. The MACD line is placed above the signal line and waits for any type of crossover. Stellar cryptocurrency investors should wait for a change in direction on the daily chart.
Summary
On the daily chart, the price of the Stellar cryptocurrency was moving between a horizontal price range of $0.146530 and $0.134468. However, to speed up the recovery phase, Stellar cryptocurrency needs to gather buyers. Technical indicators indicate a period of price consolidation for the XLM cryptocurrency. Investors should monitor directional changes on the daily chart. However, investors and traders must be properly prepared for the next step and avoid FOMO.
Technical Levels
Support Levels: $0.110563 and $0.100067
Resistance Levels: $0.134468 and $0.146530.
Disclaimer
The analysis provided in this article is for informational and educational purposes only. Do not rely on this information as financial, investment, or trading advice. Investing and trading in crypto involves risk. Please assess your situation and risk tolerance before making any investment decisions.

Andrew is a blockchain developer who developed his interest in cryptocurrencies while pursuing his post-graduation major in blockchain development. He is a keen observer of details and shares his passion for writing, along with coding. His backend knowledge about blockchain helps him give a unique perspective to his writing skills, and a reliable craft at explaining the concepts such as blockchain programming, languages and token minting. He also frequently shares technical details and performance indicators of ICOs and IDOs.


