
 Home
Home News
News
- 1 AAVE price noted a massive recuperation and is riding the gains.
- 2 AAVE price showed a breakout and has persisted in extending the rally.
AAVE price healed from the bottom mark of $50 and has retained the bullish trajectory above $100 smartly in the recent sessions. Moreover, the price action has displayed the bullish momentum and AAVE price continues to flight up the gains above $100 and has pulled back from the 20 day EMA mark in the last sessions. Buyers have regained momentum and persisted in accumulating the gains.
AAVE price has surpassed the key moving averages and is displaying bullishness on the charts. Moreover, the technicals are replicating the outperformance and suggest that AAVE price may surpass $110, and will reach the swing mark of $120 followed by $130 in the next sessions. Per the Fibonacci retracement zone, AAVE price has surpassed the 50% zone and is close to the upper bollinger band exhibit uptrend on the charts.
The live price of AAVE crypto is $110 with an intraday gain of 14.26% showing bullishness on the charts. Moreover, the trading volume increased by 9.80% to $293.28 Million. However, the pair of AAVE/BTC is at 0.00258 BTC and the market cap is $1.64 Billion. Analysts are bullish and suggest that buying momentum will continue and AAVE price will reach $120 soon.
AAVE on Daily Chart Displays Range Breakout
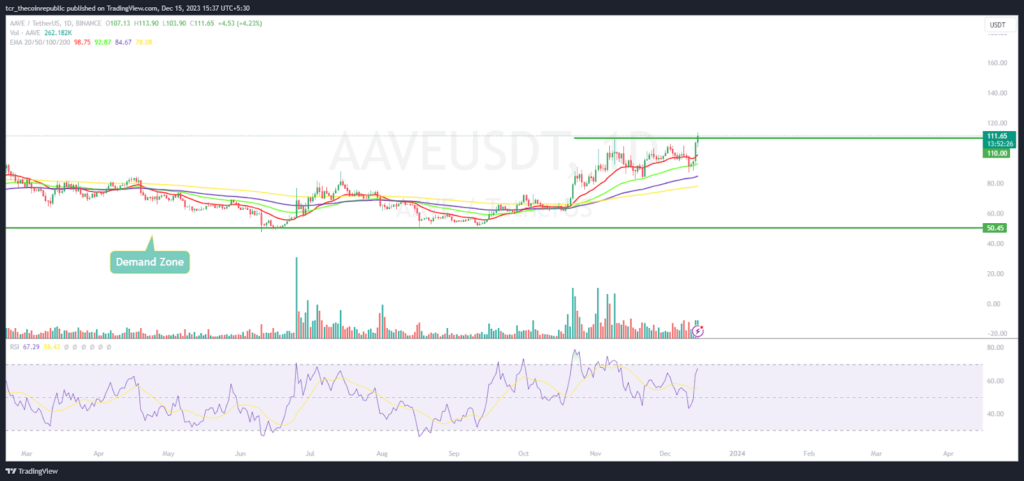
On the daily chart, AAVE price is trading close to the make or break zone of $110, which if surpassed, will lead to the swing high of $120. Conversely, if it fails, will retest the round mark of $100. The price action demonstrated the buying on dips and a higher highs formation was noted on the charts.
The Relative strength index (RSI) curve stayed in the overbought zone and pulled back from the neutral region and exhibited the rebound on the charts.
The MACD indicator showed a bullish crossover, suggesting that buyers are willing to escape the prompt hurdle of $110 in the coming sessions.
Weekly Charts Displays Rebound From Demand Zone
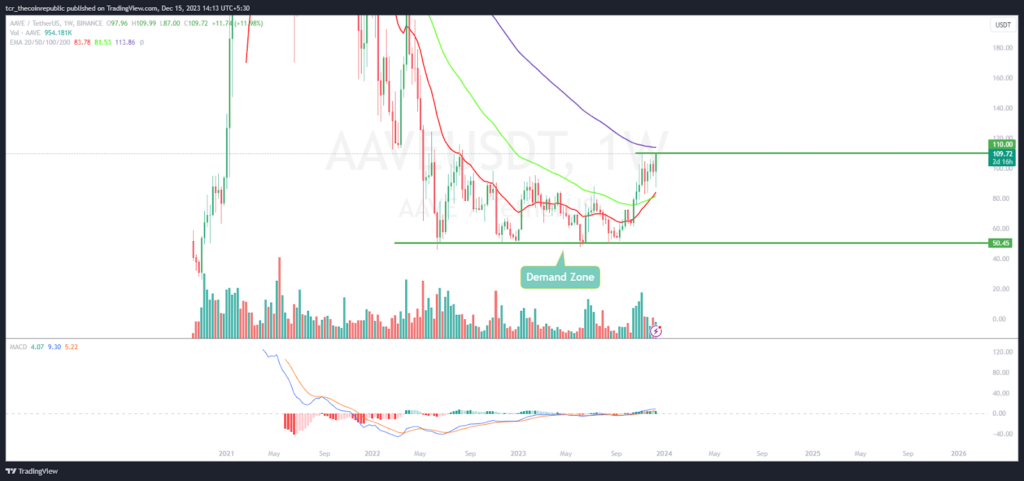
On the weekly chart, AAVE token price resurfaced from the demand zone of $50, made a triple bottom pattern and is close to the 100 day EMA. Moreover, the chart displayed the range breakout and fresh buying interest was witnessed on the chart. The price action highlights bullish momentum and that AAVE price may continue to gain. It is expected reach $120 in the coming sessions.
Summary
AAVE price displayed a rebound from the 20 day EMA mark and is close to the make or break zone ($110). Buyers are trying to escape to reach the blue sky zone above $115. If bulls succeed to surpass the barrier, buyers will extend the rally and target the primary hurdle of $125.
Technical Levels
Support Levels: $100 and $90
Resistance Levels: $115 and $120
Disclaimer
The views and opinions stated by the author or any other person named in this article are for informational purposes only and do not constitute financial, investment, or other advice. Investing in or trading crypto or stocks comes with a risk of financial loss.
Mr. Pratik chadhokar is an Indian Forex, Cryptocurrencies and Financial Market Advisor and analyst with a background in IT and Financial market Strategist. He specialises in market strategies and technical analysis and has spent over a year as a financial markets contributor and observer. He possesses strong technical analytical skills and is well known for his entertaining and informative analysis of the Financial markets.


