
 Home
Home News
News
- 1 AVAX price persisted in rolling the gains and displayed a massive surge.
- 2 Buyers are gaining traction and aggressively extending the gains.
AVAX price exhibited a rally and is heading to the round mark of $50 indicating bullish momentum on the charts. Moreover, the price action reveals buyers’ accumulation, whereas sellers have lost their legacy and are covering their short positions. The technicals are showing a bullish bias and a positive trend in the recent sessions. AVAX crypto price has persisted in delivering follow-on buying after breaking out of the $23 hurdle.

AVAX price displayed a sharp surge over 80% and is displaying bullish sentiments for the past sessions.The price action replicates short covering and rally which is directed by the mighty bulls and setting their eyesight on the psychological round mark of $50 to be caught soon. Per the Fibonacci retracement zone, AVAX crypto price has sustained the gains above the 61.8% zone and is guiding breakout on the charts.

The live price of AVAX crypto is $42.32 with an intraday gain of 3.36% showing bullishness on the charts. Moreover, the trading volume increased by 14.80% to $1.84 Billion. However, the pair of AVAX/BTC is at 0.00101 BTC and the market cap is $15.57 Billion. Analysts are bullish and suggest that buying momentum will continue and that AVAX price will reach $50 soon.
AVAX on Daily Chart Displaying Price Rally
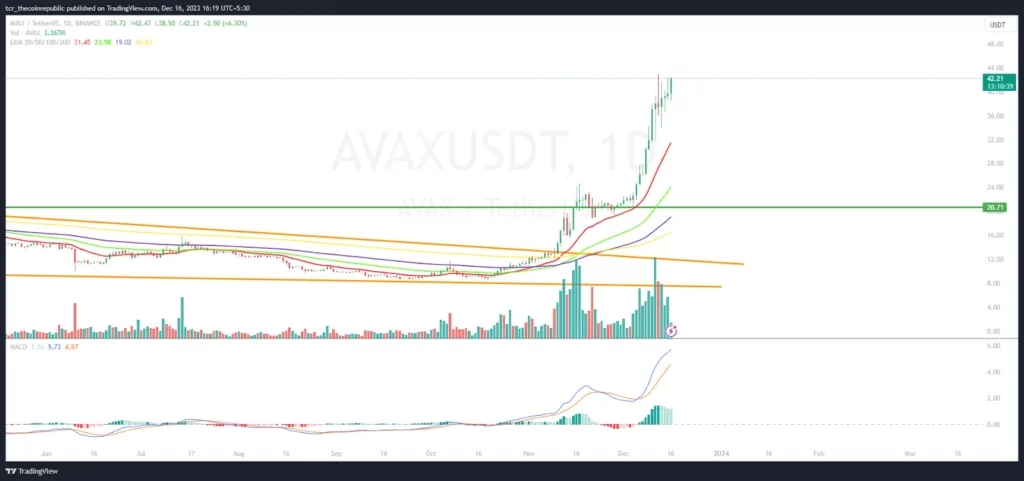
On the daily chart, AVAX price shows a breakout and is riding the gains above the key moving averages. Per the ongoing trend, AVAX crypto price has approached the bullish trajectory and will continue to outperform in the coming sessions.
The Relative Strength Index (RSI) curve stayed in the overbought zone above 80 displaying sharp buying momentum on the chart. The MACD indicator shows a bullish crossover and formed green bars on the histogram suggesting that AVAX will continue to rise in the upcoming sessions.
Weekly Charts Shows Falling Wedge Breakout
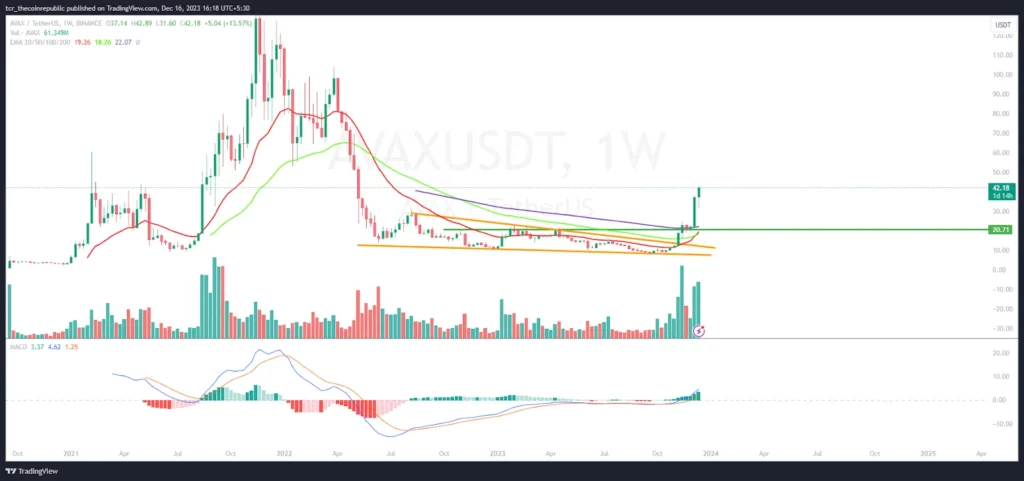
On the weekly chart, AVAX price shows the falling wedge pattern breakout and has consecutively gathered the gains following the crypto market pump. The technicals are revealing the bullish dominance and buying interest. Per the Fibonacci zone, AVAX crypto price sustained the gains above the 50% and is close to the 61.8% zone.
Summary
AVAX price uplifted gains and recuperated from the demand zone,which surpassed the swing hurdle of $30. Additionally, the price action favors the bulls and suggests that AVAX crypto will continue moving in the uptrend towards the $50 mark. The MACD and RSI are giving positive signals.
Technical Levels
Support Levels: $35 and $30
Resistance Levels: $45 and $50
Disclaimer
The views and opinions stated by the author or any other person named in this article are for informational purposes only and do not constitute financial, investment, or other advice. Investing in or trading crypto or stocks comes with a risk of financial loss.
Sam Chess is an utterly focused person looking for the minute details having potential to make a big difference. He is a writer and proofreader with a zeal to understand the cryptocurrency market. Additionally, he can be found trying to figure out the biggest mystery in the industry, Satoshi Nakamoto.
Contact :linkedin


