
 Home
Home News
News

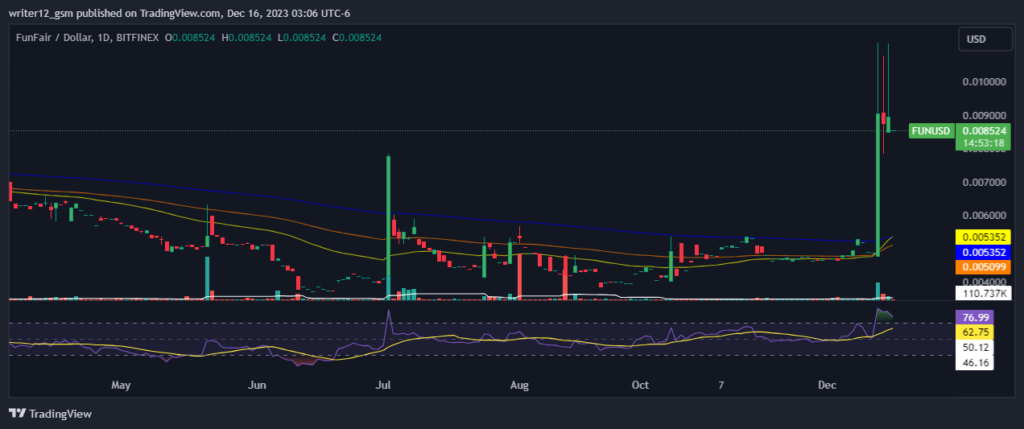
- 1 FUNUSD is trading above the key moving averages, showcasing bullishness.
- 2 FUN crypto price rose by 64.40% last week.
The current analysis of FUNToken price suggests that the FUNUSD cryptocurrency is in an uptrend after breaking out of the bearish market. On the daily time frame, the price is trading above the critical EMAs, indicating a positive outlook. However, the trading volume fell marginally, which may indicate a dip in buying and selling activity.
If the price level continues to gain buyer support, it may surge in the coming weeks and reach the $0.010000 mark. Meanwhile, the immediate support level for the token is at around $0.005352. Compared to other major cryptocurrencies, the FUN crypto chart looks stable.
To achieve the expected target, buyers have a good chance of success if the price stays above the crucial support zone, which would favor the bulls. At present, the FUN crypto is valued at $0.008524, with a market capitalization of around $93.451 Million.
The FUNToken price has been in a bullish trend for the past few months, finding consistent support from the bulls after its breakout. Based on the historical price action, the support level has played a crucial role in the demand zone.

Technical Analysis of FUN Crypto Price in 1-D Time Frame
FUNToken (FUNUSD) has steadily seen its crypto price rise for the past three months, gaining 112.64%, and 68.54% last month. Presently, FUNUSD crypto has been trying to hold on to this level after an unexpected surge in price.
It is important to note that the price of FUNToken may continue to rise and reach the first and second targets of $0.011171 and $0.009087 if it stays at its current level. However, if the FUNUSD price drops, it may hit the nearest support levels of $0.005352 and $0.005099.
FUNToken crypto (FUNUSD) is presently trading above the 50-day and 200-day exponential moving averages (EMAs), which are providing support to the price momentum. In case the buying volume increases, the price may gain bullish momentum by forming higher highs and achieving new highs. Therefore, the FUNToken price is expected to move upwards, highlighting a bullish trend over the daily time frame chart.
The Relative Strength Index (RSI) is currently at 76.99 points. The 14 SMA is positioned above the median line at 62.75 points, highlighting a bullish trend in the FUNToken crypto. The MACD line is at 0.000912, while the signal line is at 0.000450, both above the zero line. However, a bearish crossover was noticed in the MACD chart, highlighting weakness in the momentum of FUNUSD crypto price.
Summary
FUNToken (FUNUSD) technical oscillators also support the bullish trend. The MACD, RSI, and EMAs are emphasizing positive signs and imply that the uptrend may continue in the FUN crypto price. Price action suggests that the investors and traders are bullish on the 1-Day time frame.
Technical Levels
Support Levels: $0.005352 and $0.005099.
Resistance Levels: $0.011171 and $0.009087
Disclaimer
This article is for informational purposes only and does not provide any financial, investment, or other advice. The author or any people mentioned in this article are not responsible for any financial loss that may occur from investing in or trading. Please do your own research before making any financial decisions

Amanda Shinoy is one of the few women in the space invested knee-deep in crypto. An advocate for increasing the presence of women in crypto, she is known for her accurate technical analysis and price prediction of cryptocurrencies. Readers are often waiting for her opinion about the next rally. She is a finance expert with an MBA in finance. Quitting a corporate job at a leading financial institution, she now engages herself full-time into financial education for the general public.


