
 Home
Home News
News
- 1 NEAR price continues to form higher highs and persisted in extending the gains.
- 2 Buyers are looking confident and are acquiring the gains.
NEAR price presents the rising parallel channel and has endured in augmenting the gains for the past sessions. Buyers have acquired momentum and are aiming for the $3.00 mark. Moreover, the trend is robust, and optimistic sentiments were noticed in recent sessions. The technical charts show the higher highs pattern, while NEAR price is assuming support on the 20-day EMA mark, and a bullish engulfing candlestick was noted on the chart.
NEAR price is steering to claim the round mark of $3, showing bullish momentum on the chart. NEAR price surpassed the immediate hurdle of $2.50 and is targeting the swing mark of $3.
The live price of NEAR crypto is $2.42, with an intraday gain of 5.41%, showing neutrality on the charts. Moreover, the trading volume increased by 8.07% to $227.72 Million. However, the pair of NEAR/BTC is at 0.0000579 BTC, and the market cap is $1.48 Billion. Analysts have maintained a neutral rating and suggest volatility may continue in the following sessions.
NEAR Price Displayed Rising Parallel Channel
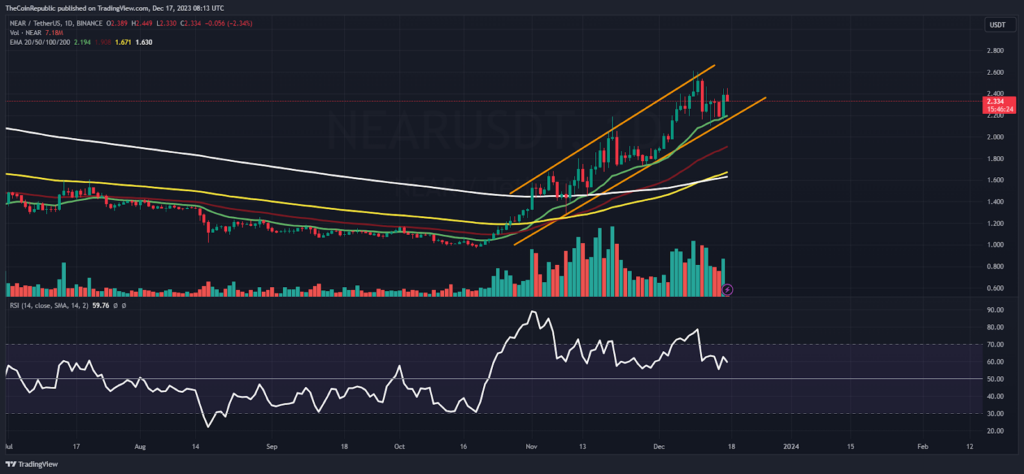
On the daily chart, the NEAR price stirred an upward move and gained inside the rising parallel channel, highlighting the buying accumulation. Moreover, the price action shows the higher highs pattern, as buyers persisted in pulling the gains slowly & steadily, conquering the battle. Per the Fib levels, the NEAR price has sustained above the 50% Fib zone and is close to the upper bollinger band.
The Relative strength index (RSI) curve stayed close to the midline near 56, showing a negative crossover and suggested that the NEAR price may face resistance near the round mark of $3.0. The MACD indicator shows a bearish crossover and formed red bars on the histogram, suggesting a volatile outlook for the upcoming sessions.
NEAR on Weekly Chart Exhibits a Rebound From Lows
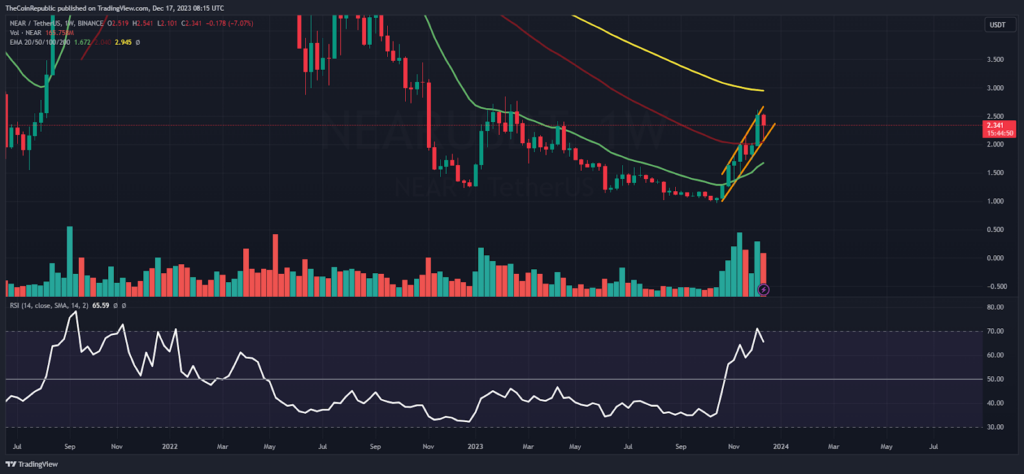
On the weekly chart, NEAR price rebounded and decisively surpassed the 20-day EMA. The technicals suggest that NEAR crypto has regained sharp momentum and is ready to retest the 200-day EMA mark in the following sessions. Moreover, the technical indicators suggest a positive buy signal that the NEAR price may surge toward $5 soon.
Summary
NEAR price chart showcased an stir and resumed accumulating gains inside the rising parallel channel over the last few sessions. Moreover, the price action shows that trend will continue, and that the bullish inclination will continue in the following sessions.
Technical Levels
Support Levels: $2.50 and $2.00
Resistance Levels: $3.00 and $3.20
Disclaimer
The views and opinions stated by the author or any other person named in this article are for informational purposes only and do not constitute financial, investment, or other advice. Investing in or trading crypto or stocks comes with a risk of financial loss.

Adarsh Singh is a true connoisseur of Defi and Blockchain technologies, who left his job at a “Big 4” multinational finance firm to pursue crypto and NFT trading full-time. He has a strong background in finance, with MBA from a prestigious B-school. He delves deep into these innovative fields, unraveling their intricacies. Uncovering hidden gems, be it coins, tokens or NFTs, is his expertise. NFTs drive deep interest for him, and his creative analysis of NFTs opens up engaging narratives. He strives to bring decentralized digital assets accessible to the masses.


