
 Home
Home News
News

- 1 ETHW price is consolidating below $3, highlighting sellers’ throwback.
- 2 ETHW price is maintaining gains and stayed close to neutrality.
ETHW price revealed refusal from the round mark of $3 and is sailing in a narrow range, showing incisiveness between the bulls and the bears. Furthermore, the price action specifies the sellers’ control, and ETHW price is facing a barrier from the upper trendline and is highlighting weakness over the last session.
ETHW price is trading close to the 20-day EMA and is forming a bullish flag pattern, denoting the uptrend on the chart. Moreover, the chart implies that the ETHW price is instituting a retracement move and is looking for a base to halt the gains. Per the Fibonacci retracement levels, ETHW price has taken support on the 50% fib zone and is close to the mid bollinger band.

The live price of ETHW crypto is $2.75, with an intraday gain of 1.63%, showing neutrality on the chart. Moreover, the trading volume increased by 9.07% to $14.81 Million. However, the pair of ETHW/BTC is at 0.0000639 BTC, and the market cap is $295.88 Million. Analysts have maintained a neutral rating and suggest volatility may continue in the following sessions.
ETHW On Daily Charts Replicating Uptrend
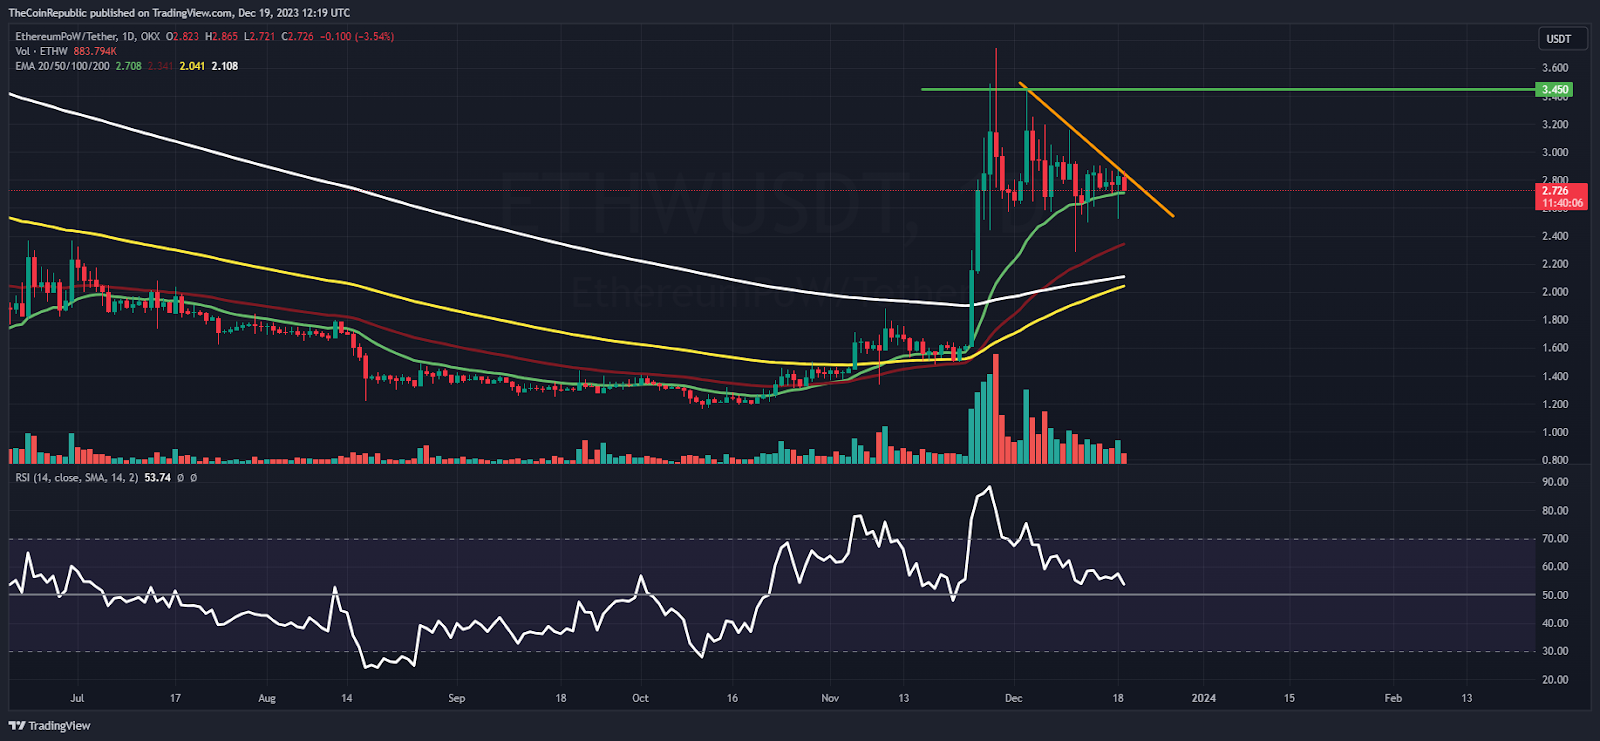
On the daily chart, ETHW price echoes a comeback and healed from the lows of $1.50, indicating buyers’ accumulation on the chart. Additionally, the correction has ended, and a fresh pullback was witnessed in the recent sessions.
The RSI curve stayed near the midline, highlighting sentiments and exhibiting consolidation on the chart. The MACD indicator shows a convergence of the MA line with the signal line that delivers the volatile outlook.
ETHW On Weekly Chart Shows Trend Reversal
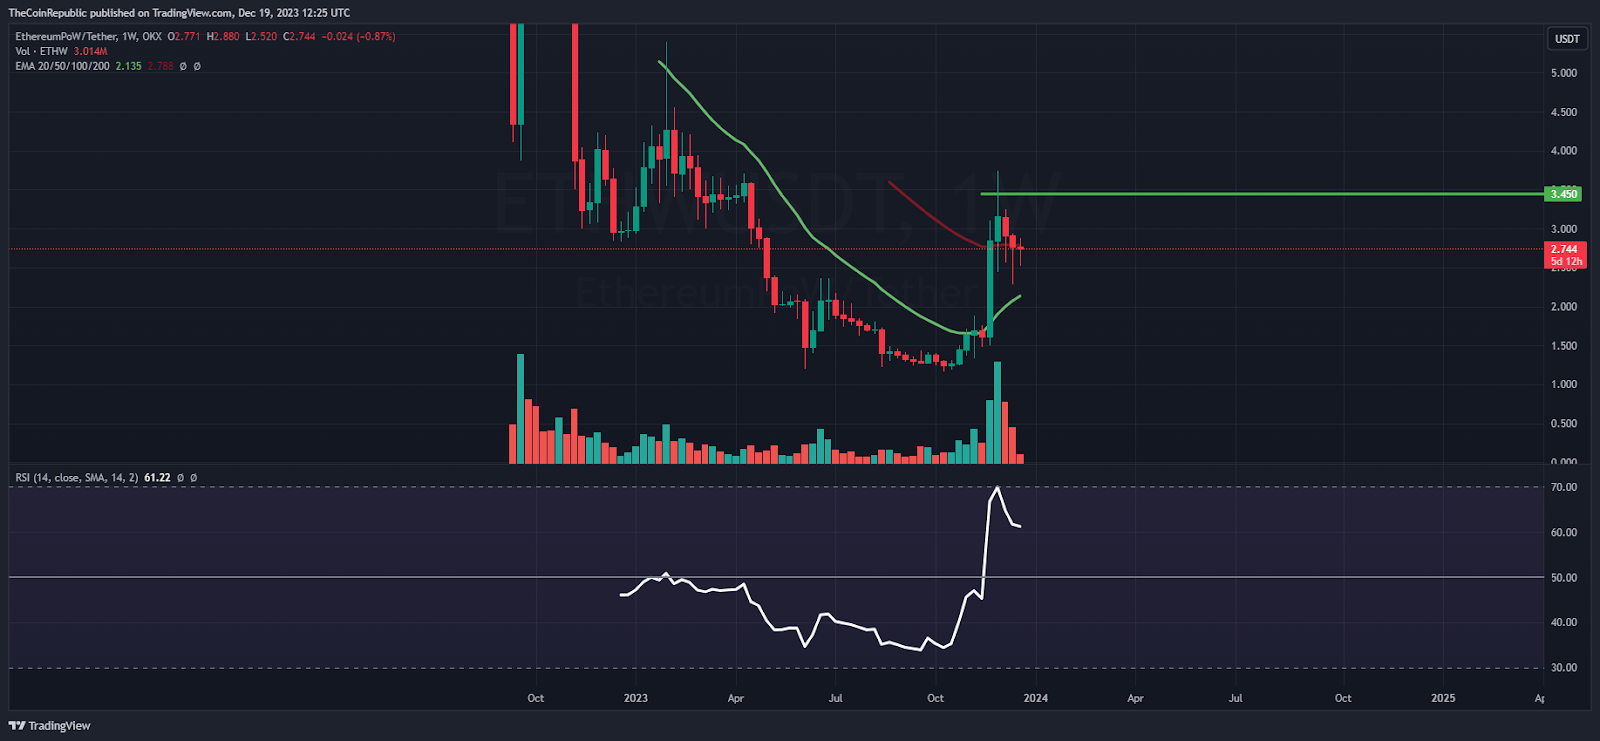
On the weekly chart, the ETHW price retreated from the demand zone and exhibited investors’ interest across recent sessions. Furthermore, the buyers have rescued strength and are look aggressive, setting their eyes on $3.
Furthermore, the ETHW price has formed a hammer candlestick near the 50-day EMA and is attempting a surge beyond the hurdle of $3. Additionally, the reversal anticipates that ETHW price may continue the bullish rally and will go to the swing high of $5 in the following sessions.
Summary
ETHW price showcased uncertainty and is terminating the gains close to the 20-day EMA mark, indicating consolidation on the chart. Moreover, the price action reflects the buyers’ struggle and the rejection from the supply zone of $3. However, the trend is strong, and ETHW may continue to perform similarly in the following sessions.
Technical Levels
Support Levels: $2.50 and $2.00
Resistance Levels: $3.00 and $3.40
Disclaimer
The views and opinions stated by the author or any other person named in this article are for informational purposes only and do not constitute financial, investment, or other advice. Investing in or trading crypto or stocks comes with a risk of financial loss.

Adarsh Singh is a true connoisseur of Defi and Blockchain technologies, who left his job at a “Big 4” multinational finance firm to pursue crypto and NFT trading full-time. He has a strong background in finance, with MBA from a prestigious B-school. He delves deep into these innovative fields, unraveling their intricacies. Uncovering hidden gems, be it coins, tokens or NFTs, is his expertise. NFTs drive deep interest for him, and his creative analysis of NFTs opens up engaging narratives. He strives to bring decentralized digital assets accessible to the masses.


