
 Home
Home News
News
- 1 AXS price has persisted in gaining slowly & steadily in recent sessions.
- 2 Buyers are attempting to extend the bullishness and are looking to reach $10.
AXS price showed a massive comeback from the demand zone of $4 and is in recent sessions. Moreover, AXS crypto has completed its correction phase and is ready to reach the swing high of $10 soon. Following the crypto market pump, AXS crypto displayed a positive crossover on the chart.
AXS price has remapped from the bottom zone, forming a rising parallel channel, leading to a sharp comeback, indicating buyers’ accumulation on the chart. Furthermore, the technicals suggest that AXS crypto has retained bullishness and is preparing for the bull run beyond the swing hurdle of $10. Additionally, the market sentiments are positive, which are favoring the bulls. Per the Fibonacci retracement levels, AXS price surpassed the 50% Fib zone and is close to the 61.8% zone.

The live price of AXS crypto is $0.09799, with an intraday gain of 3.50%, showing neutrality on the chart. Moreover, the trading volume increased by 1.47% to $10.78 Million. However, the pair of AXS/BTC is at 0.00000229 BTC, and the market cap is $1.50 Billion. Analysts have maintained a neutral rating and suggest a volatile outlook in the following sessions.
AXS on Daily Chart Displays Rising Parallel Channel
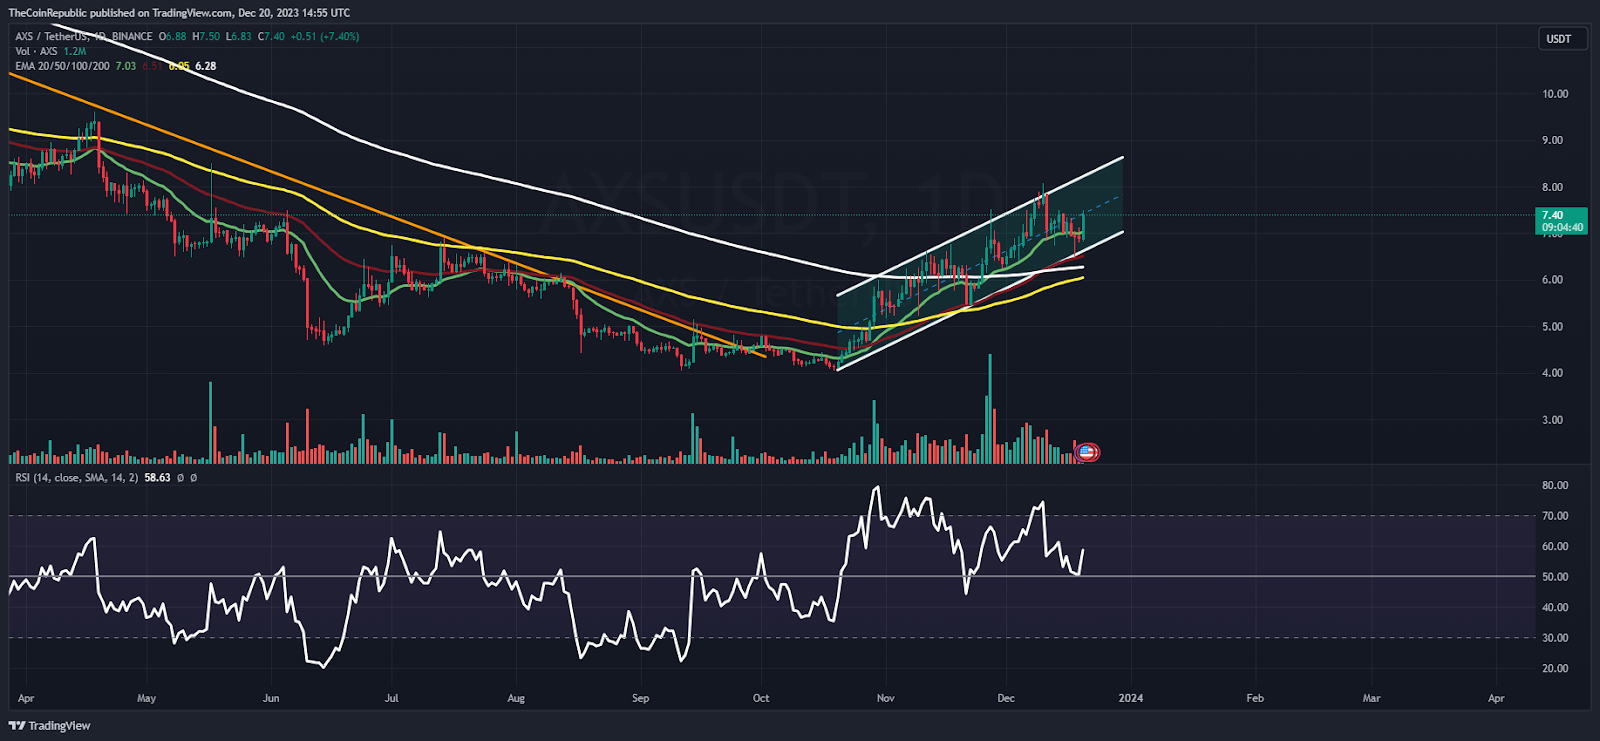
On the daily chart, AXS price showed a recovery as buyers up the pressure, and sellers are covering their short positions, which led to follow on buying in recent sessions. Moreover, the technicals suggest that AXS price is heading to retest the round mark of $10 in the following sessions.
The relative strength index (RSI) curve stayed near the midline, highlighting neutrality on the chart. Moreover, the MACD indicator showed a bullish crossover and formed green bars on the histogram, suggesting that buying momentum will persist in the following sessions.
AXS on Weekly Chart Displays Trend Reversal
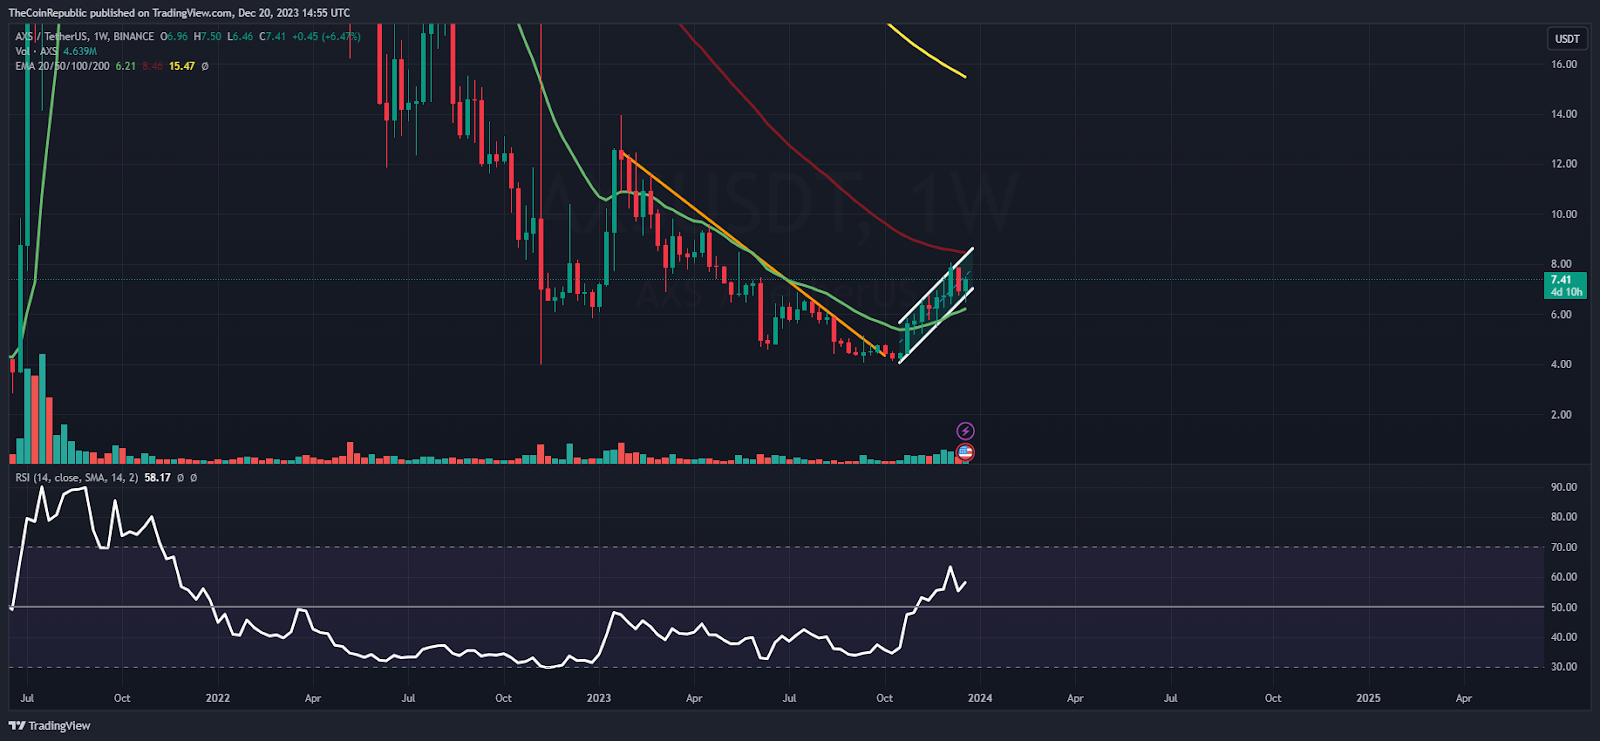
On the weekly chart, AXS price has reverted from the demand zone of $4 and surged over 90% in recent sessions. Moreover, the price action has indicated a rebound, and buyers have persisted in extending the gains inside the rising parallel channel. However, the immediate hurdle of 50 day EMA must be surpassed to continue the bull run.
Summary
AXS price has retained the bullishness and showing outperformance, displaying the trend reversal on the charts. Furthermore, the buyers have gained traction and are ready to retest the immediate hurdle of $10 in the following sessions.
Technical Levels
Support Levels: $6.50 and $6
Resistance Levels: $7 and $7.70
Disclaimer
The views and opinions stated by the author or any other person named in this article are for informational purposes only and do not constitute financial, investment, or other advice. Investing in or trading crypto or stocks comes with a risk of financial loss.

Amanda Shinoy is one of the few women in the space invested knee-deep in crypto. An advocate for increasing the presence of women in crypto, she is known for her accurate technical analysis and price prediction of cryptocurrencies. Readers are often waiting for her opinion about the next rally. She is a finance expert with an MBA in finance. Quitting a corporate job at a leading financial institution, she now engages herself full-time into financial education for the general public.


