
 Home
Home News
News
- 1 INJ price shows the higher high rows pattern and is heading to the $50 mark.
- 2 Buyers are gaining traction and persisted in extending the bull rally.
INJ price displayed a massive bullish momentum and has led a rebound from the demand zone of $7, reflecting a golden crossover on the chart. Following the positive sentiments and the crypto market pump, INJ crypto has surged over 245% in the last month. Moreover, the price action reveals the bulls’ dominance, and that the sellers are trapped. Furthermore, buyers have persisted in extending the gains, and follow-on buying was witnessed in recent sessions.
INJ price exhibited a massive surge over the past sessions and healed from the demand zone of $10, displaying buyers’ accumulation. Additionally, the sellers were in trouble and covering their positions, resulting in a short covering rally in the recent sessions. Furthermore, the INJ price has climbed above the neutrality and will retest the round mark of $50.

The live price of INJ crypto is $42.09, with an intraday gain of 6.73%, showing bullishness on the chart. Moreover, the trading volume increased by 15.33% to $613.87 Million. However, the pair of INJ/BTC is at 0.000989 BTC, and the market cap is $3.62 Billion. Analysts have maintained an outperform rating and suggest that the rally will continue in the following sessions.
INJ on Daily Chart Displays Bulls’ Dominance
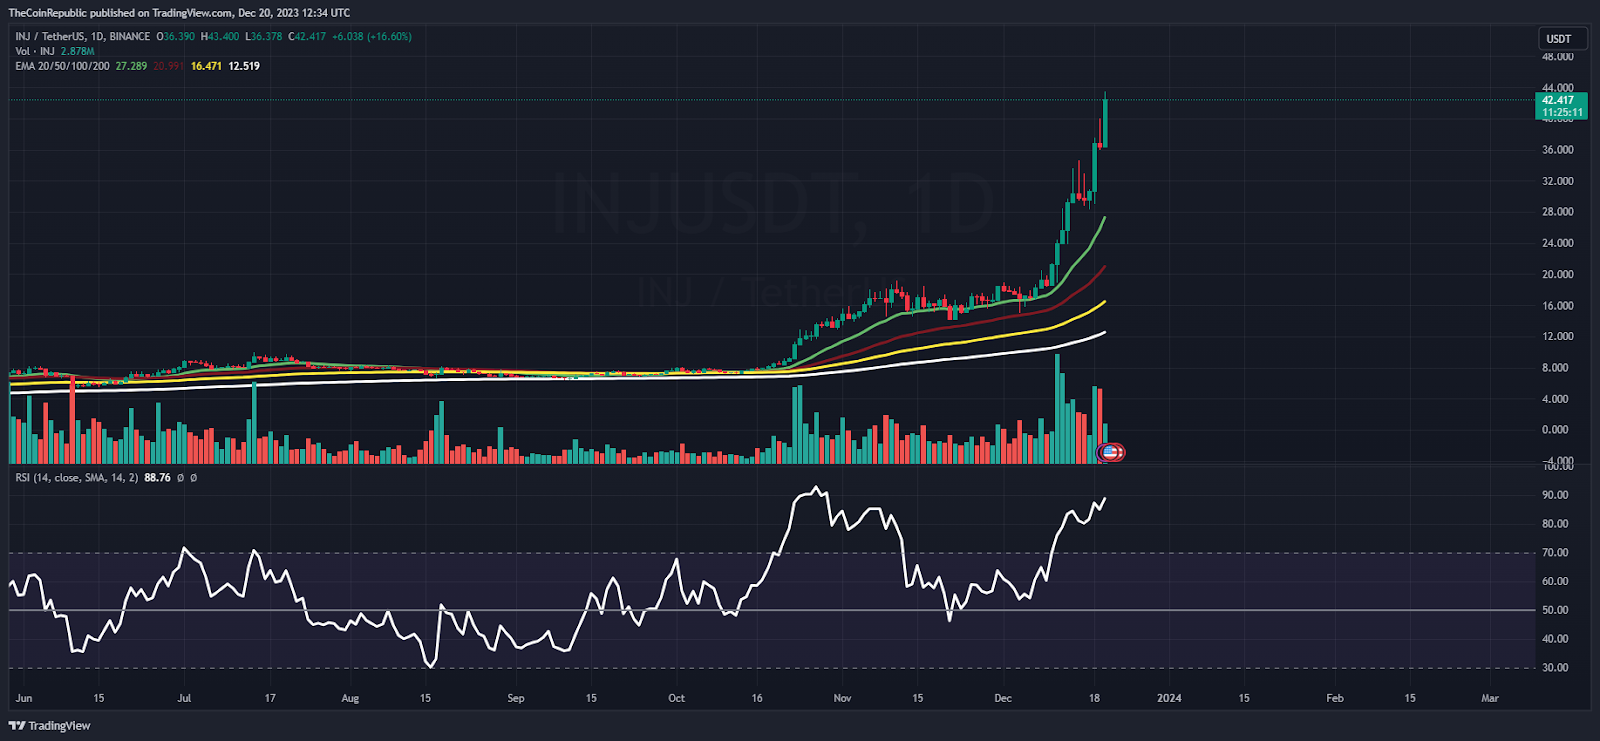
On the daily chart, INJ price has climbed above the significant moving averages and displayed bullishness in the recent sessions. Furthermore, the price action reveals the breakout, and a rally is displayed on the charts. The INJ price has surpassed the 61.8% Fibonacci retracement zone, is above the upper bollinger band, and has registered a breakout.
The relative strength index (RSI) curve stayed in the overbought zone and formed a positive crossover, indicating a strong bullish outlook for the following sessions. The MACD indicator shows a bullish crossover and green bars on the histogram, suggesting a favorable optimistic outlook.
Weekly Charts Displays Massive Recuperation From Demand Zone
On the weekly chart, INJ price displayed a massive surge and gained over 300% in the recent sessions. Furthermore, the technicals are replicating bullishness and suggest that INJ price has approached the bullish territory and is reflecting outperformance on the charts. Per the Fib levels, INJ price has surpassed the supply zone of $40 and has split the sellers grip.
Summary
INJ price shows a massive rally and has healed from the demand zone of $10, reflecting outperformance on the charts. Moreover, the price action indicates the buyers’ accumulation, and bulls have taken the authority and have persisted in showing their legacy from the past sessions.
Technical Levels
Support Levels: $40 and $35
Resistance Levels: $50 and $60
Disclaimer
The views and opinions stated by the author or any other person named in this article are for informational purposes only and do not constitute financial, investment, or other advice. Investing in or trading crypto or stocks comes with a risk of financial loss.

Adarsh Singh is a true connoisseur of Defi and Blockchain technologies, who left his job at a “Big 4” multinational finance firm to pursue crypto and NFT trading full-time. He has a strong background in finance, with MBA from a prestigious B-school. He delves deep into these innovative fields, unraveling their intricacies. Uncovering hidden gems, be it coins, tokens or NFTs, is his expertise. NFTs drive deep interest for him, and his creative analysis of NFTs opens up engaging narratives. He strives to bring decentralized digital assets accessible to the masses.


