
 Home
Home News
News
- 1 HBAR price formed the higher high pattern, continuing the bull rally.
- 2 Buyers have persisted in accumulating and are trying to retest the prompt hurdle of $0.1000.
HBAR price approached the bullish trajectory, displaying an uptrend in the recent sessions. Moreover, the price action shows follow-on buying action, and buyers are continuing to gain traction and are setting their vision to catch the upside mark of $0.10000. Following the crypto market pump, HBAR price continues to deliver bullishness and has persisted in outperforming the market.
HBAR price is trading above the significant moving averages and is close to claim the round mark of $0.1000. Per the ongoing trend, HBAR price has climbed to a bullish trajectory, glimpsing bullishness and the bulls’ dominance.
Additionally, the HBAR price has escaped the 61.8% Fibonacci retracement zone and has scratched the upper bollinger band.
The live price of HBAR crypto is $0.08992, with an intraday gain of 3.22%, showing neutrality on the chart. Moreover, the trading volume increased by 4.14% to $149.39 Million. However, the pair of HBAR/BTC is at 0.00000207 BTC, and the market cap is $3.04 Billion. Analysts have maintained a neutral rating and suggest that the outperformance will continue in the following sessions.
HBAR on Daily Chart Shows Bullish Movement
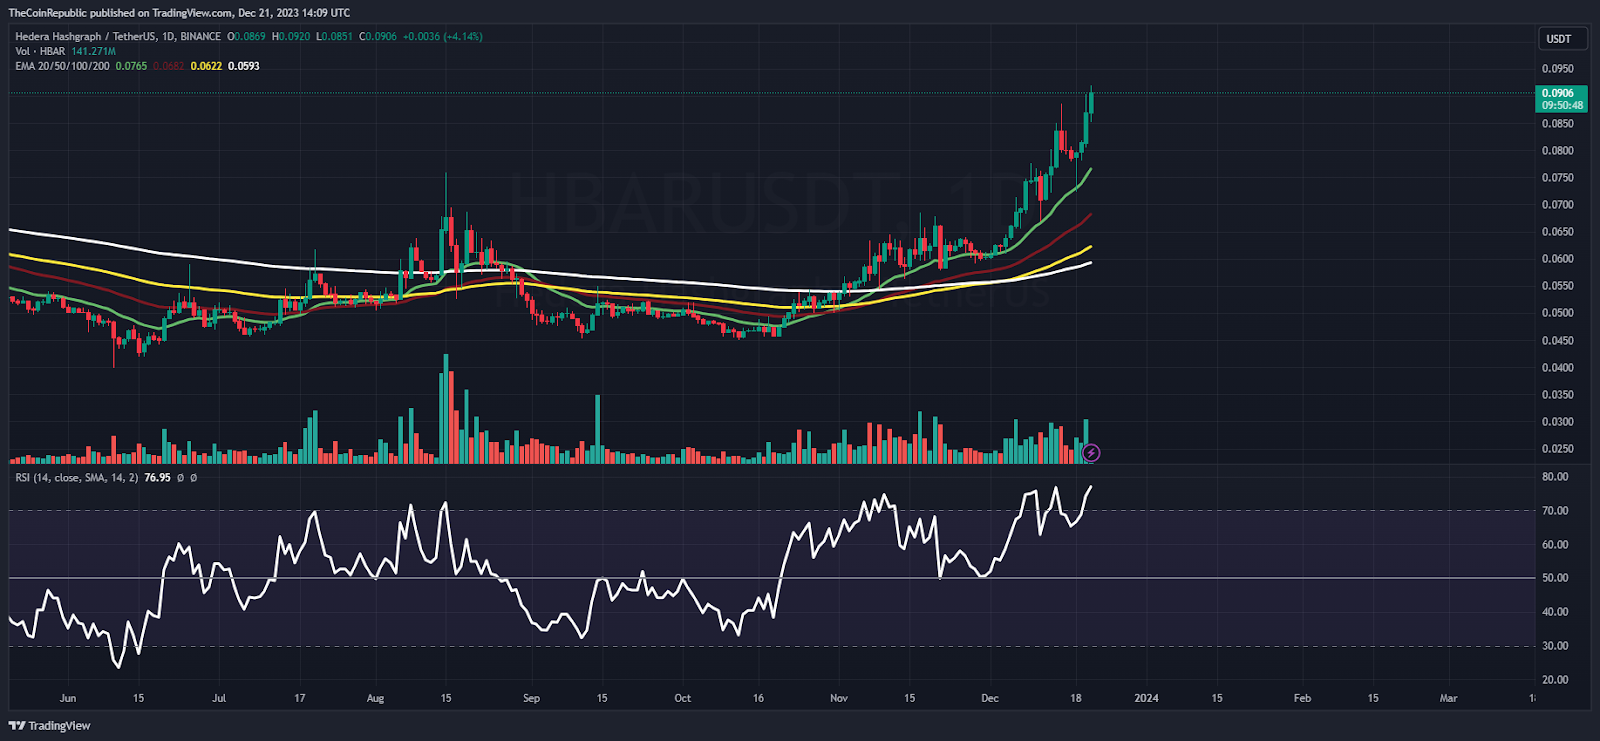
On the daily chart, HBAR price shows follow-on buying and continued the up move without taking a pause. Moreover, the price action shows the bulls’ dominance as buyers persist in extending the rally. The buyers have set their eyes on the immediate swing of $0.1000. Furthermore, the HBAR price surpassed the significant moving averages and is in an uptrend.
The relative strength index (RSI) curve stayed in the overbought zone and formed a bullish divergence on the histogram, suggesting a positive outlook for the upcoming sessions. The MACD indicator showed a positive crossover and formed green bars on the histogram, suggesting that outperformance will resume in the following sessions.
Weekly Charts Displays Double Bottom Formation
On the weekly chart, HBAR price showed a breakout above the 100-day EMA of the double bottom pattern and has surpassed the neckline of $0.08000. Per the technicals, buying momentum will continue, and the HBAR price will continue replicating the upward move.
Summary
HBAR price has surpassed the neckline of $0.08000 and has delivered a breakout, confirming bullishness on the chart. Moreover, the price action displays the follow-on buying action, and the HBAR price reached the overbought zone. The RSI and MACD are giving strong positive signals for the upcoming sessions.
Technical Levels
Support Levels: $0.0800 and $0.07700
Resistance Levels: $0.10000 and $0.12000
Disclaimer
The views and opinions stated by the author or any other person named in this article are for informational purposes only and do not constitute financial, investment, or other advice. Investing in or trading crypto or stocks comes with a risk of financial loss.

Amanda Shinoy is one of the few women in the space invested knee-deep in crypto. An advocate for increasing the presence of women in crypto, she is known for her accurate technical analysis and price prediction of cryptocurrencies. Readers are often waiting for her opinion about the next rally. She is a finance expert with an MBA in finance. Quitting a corporate job at a leading financial institution, she now engages herself full-time into financial education for the general public.


