
 Home
Home News
News
- 1 XRP price showing a retracement and is close to the support zone of $0.6000.
- 2 Buyers have failed to stretch the gains and faced rejection near $0.7300.
XRP price consolidates in a narrow range and displays range-bound moves close to the 100-day EMA mark, displaying low investor interest on the charts. Moreover, the price action shows the selling pressure, and bulls are facing rejection near the resistance mark of $0.7350 and are slid to the neutral zone of $0.6000. Furthermore, the ongoing trend suggests that the XRP price may further slip to the downside and may retest the 200-day EMA mark.
XRP price is trading near neutrality and shows seller dominance on the charts. If XRP price surpasses the swing barrier of $0.6500, it may shift the buying momentum and will cross the immediate hurdle of $0.6500. Additionally, the technicals did not favour the bulls and showed the descending triangle pattern on the charts, suggesting that, if price breaks the neckline of $0.6000, XRP price may extend the drop to the 200 day EMA support zone near $0.5600.
The live price of XRP crypto is $0.6186, with an intraday gain of 0.68%, showing neutrality on the chart. Moreover, the trading volume increased by 4.14% to $1.33 Billion. However, the pair of XRP/BTC is at 0.0000141 BTC, and the market cap is $33.70 Billion. Analysts have maintained a neutral rating and suggest that the outperformance will continue in the following sessions.
XRP on Daily Charts Displays Range Bound Move
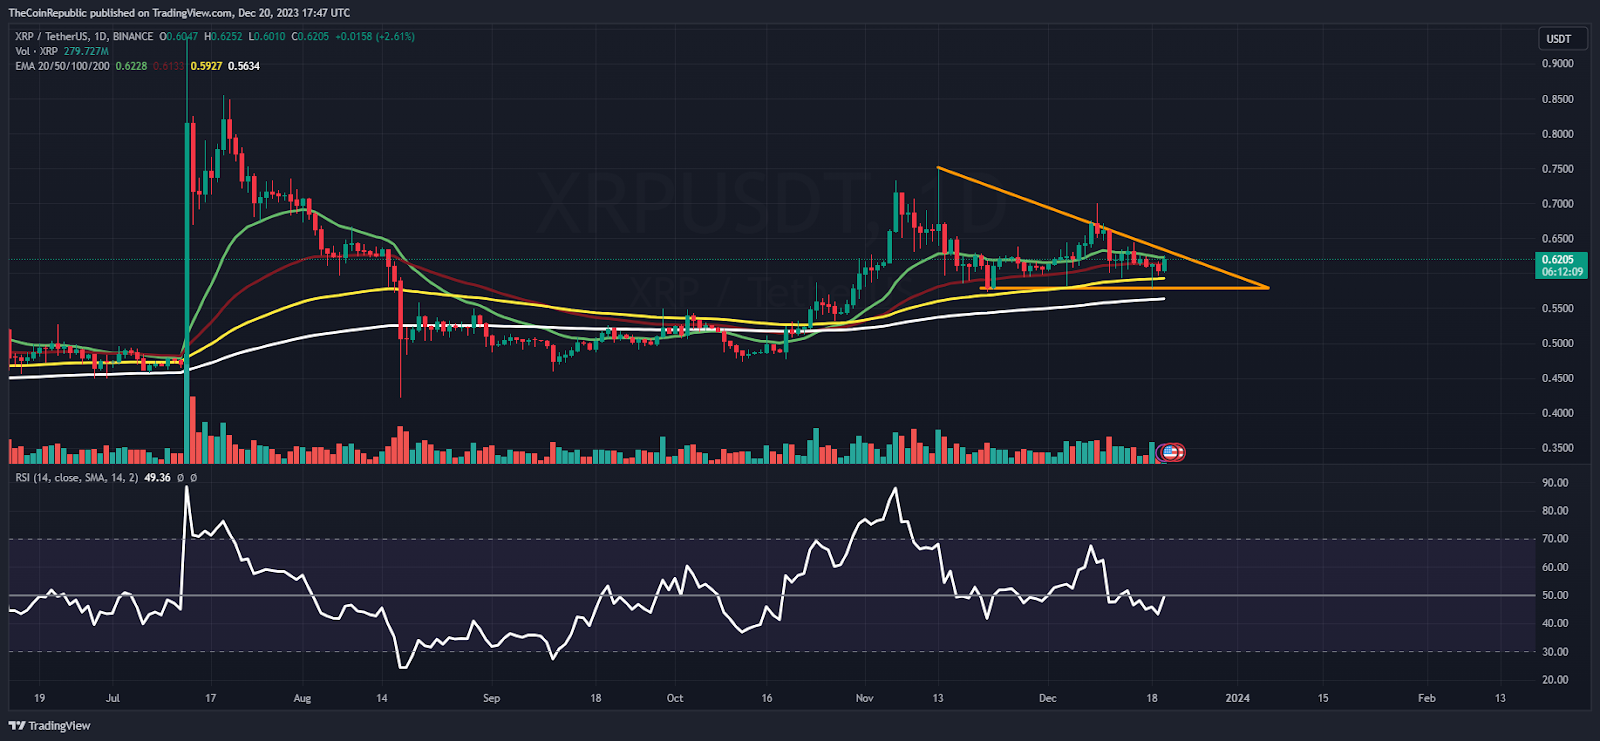
The daily charts of XRP show the range-bound moves and form a descending triangle pattern reflecting selling pressure in the recent sessions. Furthermore, the chart demonstrates that the XRP price stays in a bearish zone, buyers cannot hold the gains, and sellers continue to extend the drop for the past sessions.
The relative strength index (RSI) curve slipped below the neutrality and showed a negative crossover, reflecting that the XRP price will fall further and drop to the round mark of $0.6000 in the following sessions. The MACD indicator showed a bearish crossover and formed red bars on the histogram, suggesting underperformance for the next sessions.
XRP on Weekly Chart Prefers Further Downside
On the weekly chart, the XRP price shows a head and shoulders pattern, getting closer to the lower trendline support zone of $0.6000, near the 50-day EMA mark. Furthermore, the price action shows the lower lows formation, displaying selling pressure on the chart.
Summary
XRP price shows the range-bound movement and is taking support on the 100-day EMA, displaying seller dominance on the chart. Moreover, the price action shows profit booking in the recent sessions. Additionally, the technicals reveal that the XRP price may slide to the 200-day EMA and drag in the following sessions.
Technical Levels
Support Levels: $0.0.6000 and $0.5800
Resistance Levels: $0.6300 and $0.6600
Disclaimer
The views and opinions stated by the author or any other person named in this article are for informational purposes only and do not constitute financial, investment, or other advice. Investing in or trading crypto or stocks comes with a risk of financial loss.

Adarsh Singh is a true connoisseur of Defi and Blockchain technologies, who left his job at a “Big 4” multinational finance firm to pursue crypto and NFT trading full-time. He has a strong background in finance, with MBA from a prestigious B-school. He delves deep into these innovative fields, unraveling their intricacies. Uncovering hidden gems, be it coins, tokens or NFTs, is his expertise. NFTs drive deep interest for him, and his creative analysis of NFTs opens up engaging narratives. He strives to bring decentralized digital assets accessible to the masses.


