
 Home
Home News
News
- 1 Moonbeam crypto price is currently trading at $0.379 with a 2.99% drop in the last 24 hours.
- 2 GLMR has a current market cap of $305.692 Billion.
Moonbeam price action indicates bullishness, as GLMR crypto keeps the gains on the upper side in the bullish zone and ignores rejections. The bears are still making short positions and trying to pull back.
Moonbeam crypto displayed bullishness and has held onto the gains above the top. Bulls are accumulating the crypto and getting ready to cross the $0.400 mark in the following sessions.
The chart formation shows the bulls’ momentum and signals a positive outlook. GLMR crypto is expected to break out soon, and investors are watching it closely.
The chart shows strong bullish price action, highlighting buyers’ dominance. Long buildup activity was noted in the past trading sessions. Furthermore, sellers have become cautious due to the vertical rally that trapped sellers in the past weeks.
Moonbeam’s price was at $0.379 and has gained 2.99% of its market capitalization during the day’s trading session. The last 24-hour trading volume was 27.651 Million. This demonstrates that buyers are trying to accumulate in order to surge toward the upper price range.
Technical Analysis of Moonbeam Crypto Price in 1-D Time Frame
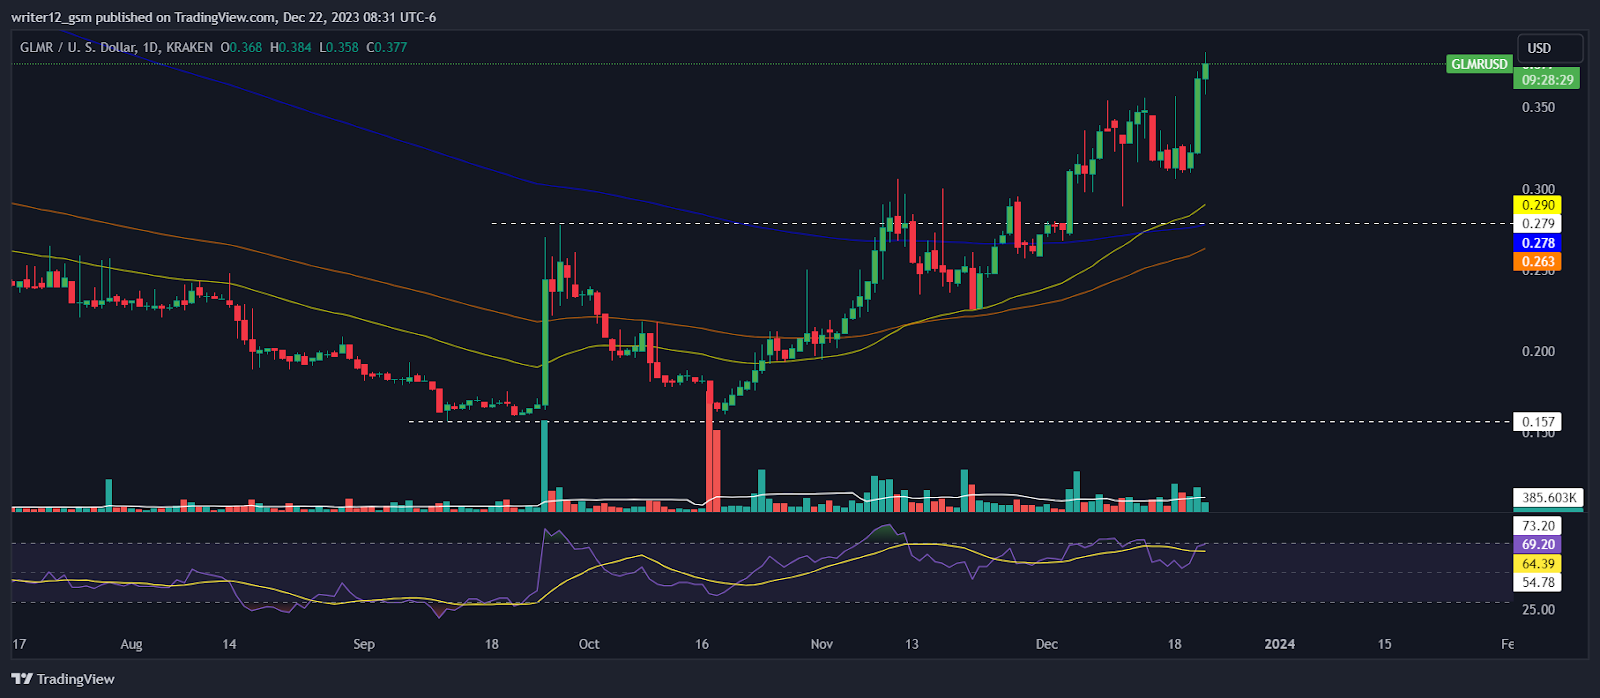
Moonbeam (USD: GLMR) has steadily seen its crypto price rise for the past three months, gaining 135.80% and 68.28% in the last month. Currently, GLMR crypto is trying to hold on to this level after an unexpected surge in price.
Currently, Moonbeam crypto (USD: GLMR) is trading above the 50 and 200-day daily moving averages (DMAs).
The current value of RSI is 69.20 points. The 14 SMA is above the median line at 64.88 points which indicates that the Moonbeam crypto is bullish.
The MACD line at 0.019 and the signal line at 0.018 are above the zero line. A bearish crossover is observed in the MACD indicator which signals weakness in the momentum of the GLMR crypto price.
Weekly-Time Horizon Analysis
Moonbeam crypto has shown buyers’ strength on the weekly charts. Moreover, the price traded above the key EMAs, which shows further strength in the crypto. The RSI curve is near the overbought region at 74, and a positive outlook was noted, indicating bullishness in the crypto. The MACD indicator also persisted to form green bars, and a bullish crossover was noted, which signals bullish moves.
Summary
Moonbeam (USD: GLMR) technical oscillators also support the bullish trend. The MACD, RSI, and EMAs are emphasizing positive signs and imply that the uptrend may continue in the GLMR crypto price. Price action suggests that the investors and traders are bullish on the 1-Day time frame. The price action reflects a bullish perspective at the moment.
Technical Levels
Support Levels: $0.290 and $0.278.
Resistance Levels: $0.400 and $0.500.
Disclaimer
This article is for informational purposes only and does not provide any financial, investment, or other advice. The author or any people mentioned in this article are not responsible for any financial loss that may occur from investing in or trading. Please do your own research before making any financial decisions

Nancy J. Allen is a crypto enthusiast, with a major in macroeconomics and minor in business statistics. She believes that cryptocurrencies inspire people to be their own banks, and step aside from traditional monetary exchange systems. She is also intrigued by blockchain technology and its functioning. She frequently researches, and posts content on the top altcoins, their theoretical working principles and technical price predictions.


