
 Home
Home News
News

- 1 PlayDapp crypto price is currently trading at $0.2139 with a gain of 0.56% in the last 24 hours with a current market cap of $123.506 Billion.
- 2 PLA price surged in the previous session, highlighting bulls’ dominance.
PlayDapp shows a strong chart structure in recent trading sessions. The price was trading above the key moving averages and reflected the buyers’ power. The sellers were wary of the competition and waited for a decline to show their influence. But seeing the rise, they were closing their positions, and remained on the sidelines. The buyers kept making long positions and moved steadily towards the $0.2100 mark.
PLA crypto was trading at $0.2139 at the time of writing with a slight increase of 0.56% for the day, showing bullishness in the last trading session. The trading volume for the day was 5.694 Million. The market cap of PLA crypto was $123.506 Billion. The crypto displayed the bulls’ strength and sustained the gains.

On the daily chart, PlayDapp crypto stayed on the top, near the supply zone, holding the gains convincingly. Buyers have an edge and have dominated the past few trading sessions. Moreover, the price persisted in forming higher highs. Sellers were trapped during the rebound.
As per the crypto technicals, analysts maintained a buy rating, and the target price of $0.2200 was recently retested, highlighting the bullishness.
Technical Analysis of PlayDapp crypto Price in 1-D Time Frame
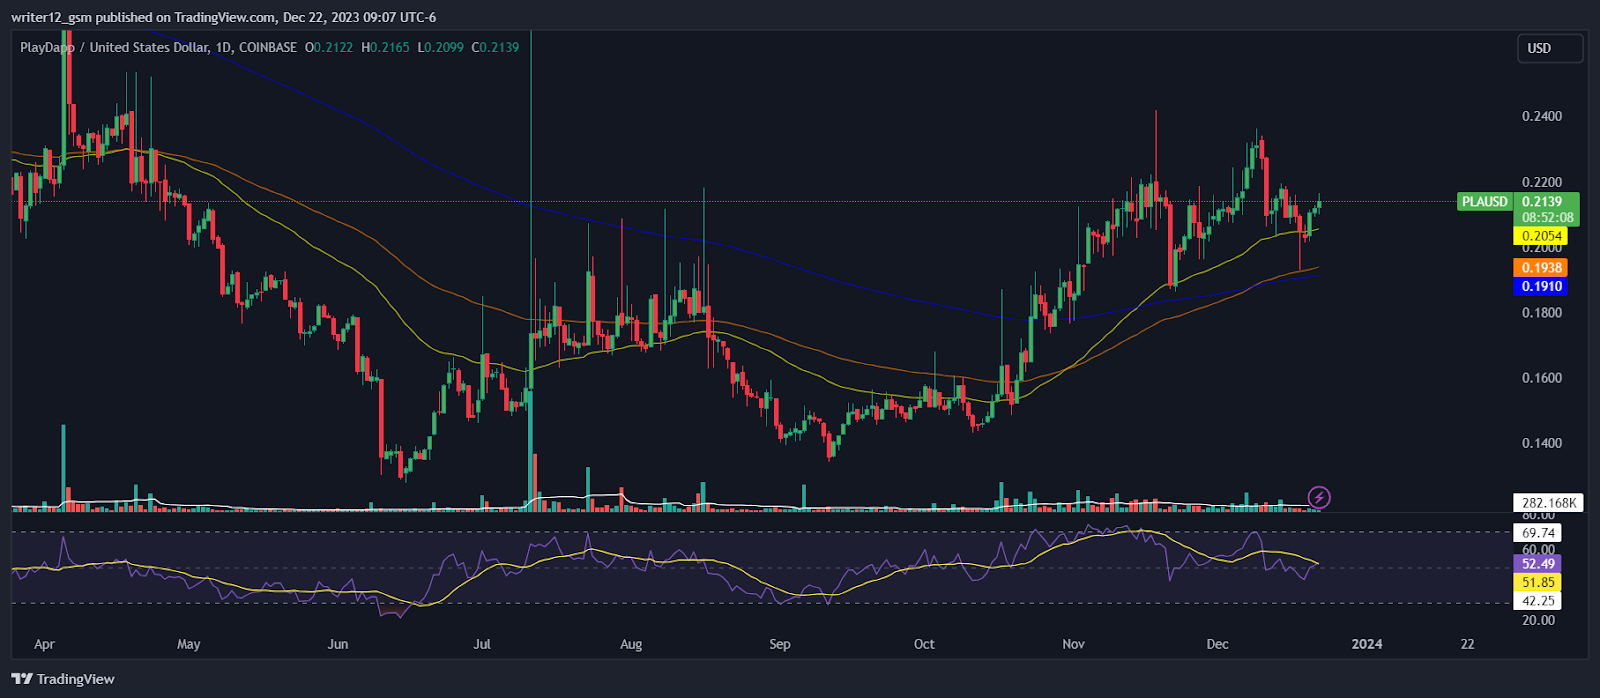
Currently, PlayDapp crypto (crypto: PLA) is trading above the 50 and 200-day daily moving averages (DMAs), which are supporting the price momentum.
However, if buying volume adds up, then the price might support bullish momentum by making higher highs and new highs. Hence, the PlayDapp price is expected to move upwards giving bullish views over the daily time frame chart.
The current value of RSI is 52.49 points. The 14 SMA is above the median line at 51.85 points which indicates that the PlayDapp crypto is bullish.
The MACD line at 0.0004 and the signal line at 0.0015 are above the zero line. A bearish crossover is observed in the MACD indicator which signals weakness in the momentum of the PLA crypto price.
The weekly chart of PlayDapp crypto reveals a neutral perspective. The crypto has been on a downward trend as it was trading below the key EMAs. The technical indicators also confirm the neutral sentiment, as the RSI is near the oversold zone at 50 while the MACD formed green bars. These signals indicate that the crypto is neutral.
Summary
PlayDapp (USD: PLA) oscillators are currently indicating that the price is overbought. The investors are not very optimistic regarding the crypto. The MACD, RSI, and EMAs are emphasizing positive signs and imply that the uptrend may continue in the PLA crypto price. Price action suggests that the investors and traders are bullish on the 1-Day time frame. The price action reflects a bullish perspective at the moment.
Technical Levels
Support Levels: $0.2054 and $0.1910
Resistance Levels: $0.2200 and $0.2300
Disclaimer
The analysis provided in this article is for informational and educational purposes only. Do not rely on this information as financial, investment, or trading advice. Investing and trading in crypto involves risk. Please assess your situation and risk tolerance before making any investment decisions.

With a background in journalism, Ritika Sharma has worked with many reputed media firms focusing on general news such as politics and crime. She joined The Coin Republic as a reporter for crypto, and found a great passion for cryptocurrency, Web3, NFTs and other digital assets. She spends a lot of time researching and delving deeper into these concepts around the clock, and is a strong advocate for women in STEM.


