
 Home
Home News
News
- 1 ANKR crypto price was trading at $0.02990 (press time) with a drop of 2.03% in the last 24 hours, at a market cap of $298.3 Million.
- 2 ANKR crypto price chart indicates bullishness and a positive outlook.
- 3 Bulls are regaining strength and are trying to extend their gains.
Ankr crypto is trading in bullish territory above major moving averages, showing bullish momentum. On the daily chart, the ANKR cryptocurrency is moving higher and is above the 50-day EMA.
The price action suggests that the cryptocurrency is poised for a significant uptrend with a potential price increase in the coming sessions. Buyers are working hard to maintain these levels.

The ANKR cryptocurrency price chart indicates increased buyer activity. Moreover, the price action is still forming higher highs and higher lows on the chart, indicating that the cryptocurrency is bullish and has no intention of slowing down.
The structure of the chart suggests that buyers are driving the trend and the cryptocurrency is gradually approaching the $0.03200 mark, which it is likely to reach soon. Additionally, sellers have found themselves in a defensive position after breaking multiple resistance levels above $0.03000 with significant vertical gains over the last few trading sessions. Investors are showing strong intent to continue this upward trend.
At the time of publication, the ANKR cryptocurrency was trading at $0.02990 with an intraday decline of 2.03%, showing an optimistic mood on the chart. It also has a trading volume of 24.38 Million and a market capitalization of $298.3 Million.
Technical Analysis of ANKR Crypto Price in 1-D Time Frame
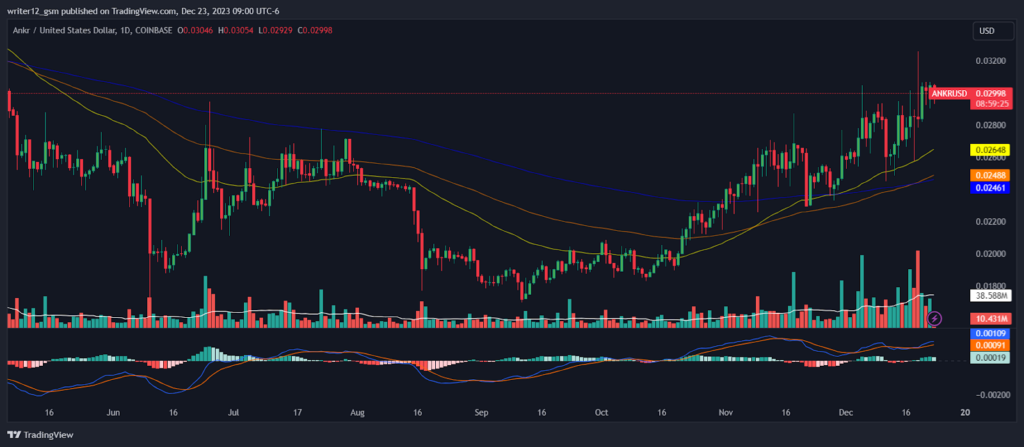
ANKR (USD: Ankr) is currently trading above its 50-day and 200-day simple moving averages (SMAs), which support the price momentum.
The current RSI value is 61.46 points. The 14 SMA is above the center line at 57.90 points, highlighting the bullish nature of the ANKR cryptocurrency.
The MACD line at 0.00109 and the signal line at 0.00091 are above the 0 line. There is a bullish crossover in the MACD indicator, which indicates strong momentum in the price of the Ankr cryptocurrency.
Summary
Technical Oscillators ANKR (USD: Ankr) are also supporting the bullish trend. MACD, RSI, and EMA highlight positive signals, suggesting that the upward trend in the price of the Ankr cryptocurrency may continue. Price action suggests that investors and traders are optimistic daily. Price movements reflect the current optimistic outlook. However, investors and traders must wait to be properly prepared for the next step and avoid FOMO.
Technical Levels
Support Levels: $0.02648 and $0.02487
Resistance Levels: $0.03064 and $0.03254
Disclaimer
This article is for informational purposes only and does not provide any financial, investment, or other advice. The author or any people mentioned in this article are not responsible for any financial loss that may occur from investing in or trading. Please do your own research before making any financial decisions.

Adarsh Singh is a true connoisseur of Defi and Blockchain technologies, who left his job at a “Big 4” multinational finance firm to pursue crypto and NFT trading full-time. He has a strong background in finance, with MBA from a prestigious B-school. He delves deep into these innovative fields, unraveling their intricacies. Uncovering hidden gems, be it coins, tokens or NFTs, is his expertise. NFTs drive deep interest for him, and his creative analysis of NFTs opens up engaging narratives. He strives to bring decentralized digital assets accessible to the masses.


