
 Home
Home News
News

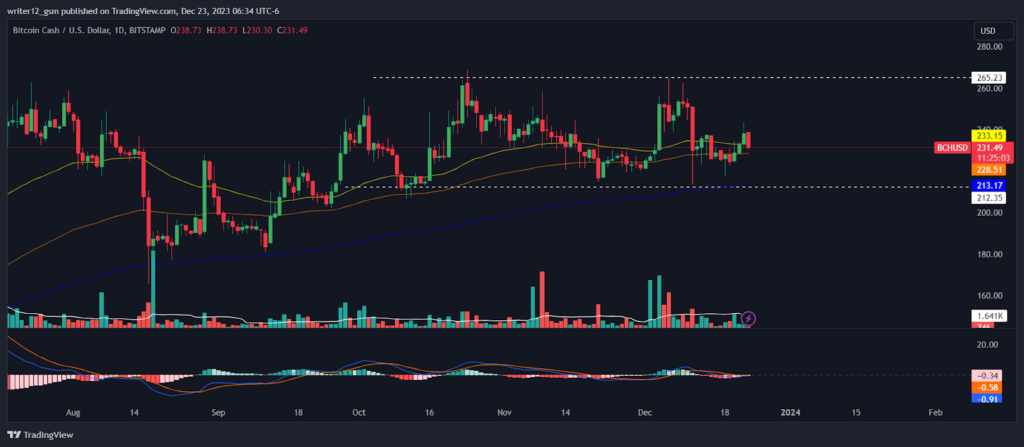
- 1 Bitcoin Cash is struggling between 100-day & 200-day moving averages.
- 2 Technical indicators indicate the consolidation of Bitcoin Cash crypto.
- 3 Bitcoin Cash’s price has been consolidating inside the horizontal price range of $265.23 and $212.35 over the daily time frame chart.
The Bitcoin Cash price forecast indicates that the market direction is unclear for both sellers and buyers. Investors might want to wait for more technical signals to confirm the trend. The green candle is slightly rising, showing that the BCH price is drawing buyers in the support zone

The market mood for the Bitcoin Cash price is currently uncertain and might stay negative until buyers show more interest in the price movements. However, based on the technical indicators and the price behavior, the chances are on the side of the bulls.

The price of the Bitcoin Cash cryptocurrency will attract buyers towards the upper trend line of the consolidation phase on the daily chart. Meanwhile, the Bitcoin Cash cryptocurrency price is trying to find support and rise towards the 20-day, 50-day, 100-day and 200-day moving averages.
The Bitcoin Cash cryptocurrency is consolidating with a horizontal price range from $265.23 to $212.35. However, the price of Bitcoin Cash cryptocurrency gained by about 1.97% in one week and rose by 3.43% in one month. Additionally, the price of the BCH cryptocurrency rose approximately 11.12% over the past three months and by approximately 19.01% over the past six months. However, the Bitcoin Cash cryptocurrency chart is showing a positive trend. However, analysts believe that the price of the cryptocurrency may rebound from low levels.
Bitcoin Cash Crypto Price Has Been Consolidating Inside the Price Range
To reach the upper limit of the consolidation phase, the price of the Bitcoin Cash cryptocurrency must begin to rise. However, for the Bitcoin Cash cryptocurrency to enter the recovery phase, it needs to accumulate buyers. Meanwhile, the price of Bitcoin Cash cryptocurrency fell below the 200-day moving average.
Additionally, the Bitcoin Cash cryptocurrency should register a breakout during the consolidation phase on the daily chart.
Technical indicators indicate a consolidation phase in the price of the Bitcoin Cash cryptocurrency. The relative strength index (RSI) shows the sideways momentum of the Bitcoin Cash cryptocurrency. RSI was at 50 and trading towards neutral territory.
MACD shows the consolidation phase of the price of Bitcoin Cash cryptocurrency. The MACD line is placed above the signal line and waits for any type of crossover. Bitcoin Cash cryptocurrency investors should wait for a change in direction on the daily chart.
Summary
On the daily chart, the price of the Bitcoin Cash cryptocurrency was consolidating between a horizontal price range. However, to accelerate towards the recovery phase, Bitcoin Cash cryptocurrency needs to accumulate buyers. Technical indicators indicate a period of price consolidation for the BCH cryptocurrency. Bitcoin Cash cryptocurrency investors should monitor directional changes on the daily charts.
Technical Levels
Support Level: $212.35
Resistance Levels: $265.23
Disclaimer
The analysis provided in this article is for informational and educational purposes only. Do not rely on this information as financial, investment, or trading advice. Investing and trading in crypto involves risk. Please assess your situation and risk tolerance before making any investment decisions.

Amanda Shinoy is one of the few women in the space invested knee-deep in crypto. An advocate for increasing the presence of women in crypto, she is known for her accurate technical analysis and price prediction of cryptocurrencies. Readers are often waiting for her opinion about the next rally. She is a finance expert with an MBA in finance. Quitting a corporate job at a leading financial institution, she now engages herself full-time into financial education for the general public.


