
 Home
Home News
News
- 1 MKR price is facing the resistance zone of $1400 and is likely to bounce.
- 2 Buyers are gaining momentum and attempting to retest the swing high of $1600.
MKR price flipped from the immediate support mark of $1250 and is gaining momentum. Moreover, the price action witnessed the buyers’ accumulation, and bulls are trying to escape the primary hurdle of $1400 to meet the swing burden of $1600. However, the trend is neutral, and the technicals did not favor a rally per the lower momentum in the last sessions. Amid the crypto market pump, MKR price barely surged over 20% and is stuck in a narrow range, showcasing neutrality on the chart.
MKR price is trying to escape the 50-day EMA hurdle to initiate a bounce ahead of the $1400 mark, while the sellers are tightening their grip and persisting in forcing the bulls backward. Moreover, the price action suggests that buyers must surpass the $1500 barrier to gain buying momentum and will shift toward $1500. Conversely, if rejected from the 50-day EMA mark, the MKR price will retest the bottom mark of $1200 again.
The live price of MKR crypto is $1353, with an intraday gain of 2.20%, showing neutrality on the chart. Moreover, the trading volume increased by 5.54% to $77.02 Million. However, the pair of MKR/BTC is at 0.0310 BTC, and the market cap is $1.32 Billion. Analysts have maintained a neutral rating, suggesting the volatility will continue in the following sessions.
MKR on Daily Chart Showcasing Neutrality
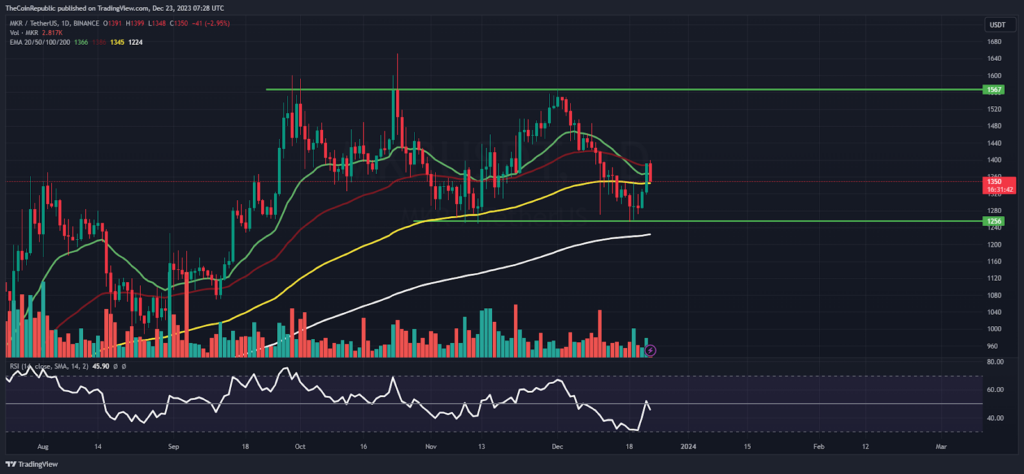
On the daily chart, MKR price showcases neutrality and stated a lower low formation for the past sessions. Moreover, the price action shows lower investor interest and meets a resistance barrier of $1400. Additionally, a bearish harami candlestick was also noted, which indicates that sellers succeeded in breaking the buyers’ momentum, and MKR price will retest the demand zone of $1200 and $1000 in the following sessions.
The relative strength index (RSI) curve stayed in the selling zone and reverted to neutrality, showing a positive crossover, indicating the bounce in the recent sessions. The MACD indicator shows a bearish crossover and red bars on the histogram, suggesting the downside risk to $1000 for the following sessions.
Weekly Charts Displays Double Bottom Formation
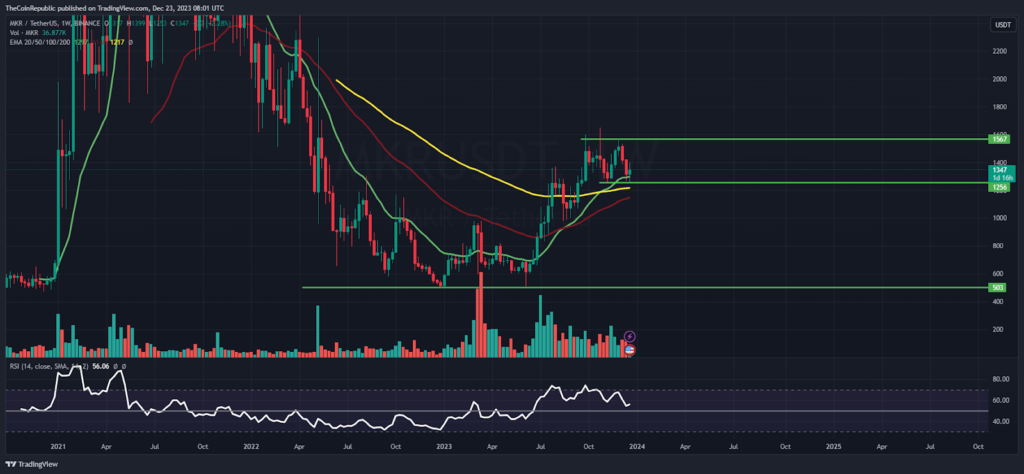
On the weekly chart, the MKR coin price delivered the double bottom formation as it reverted from the base of $500, and persisted in extending the gains. Nonetheless, MKR price is near the 50% Fibonacci retracement zone and near the mid-bollinger band.
Summary
MKR price showcased the range-bound stirs and encountered the 50-day EMA over the past number of sessions, highlighting the sellers’ dominance. Furthermore, the price action shows the rejection from the resistance zone of $1400, halting the bullish momentum. Buyers’ are likely to foresee a drop to the $1200 mark.
Technical Levels
Support Levels: $1300 and $1200
Resistance Levels: $1400 and $1500
Disclaimer
The views and opinions stated by the author or any other person named in this article are for informational purposes only and do not constitute financial, investment, or other advice. Investing in or trading crypto or stocks comes with a risk of financial loss.
Anurag is working as a fundamental writer for The Coin Republic since 2021. He likes to exercise his curious muscles and research deep into a topic. Though he covers various aspects of the crypto industry, he is quite passionate about the Web3, NFTs, Gaming, and Metaverse, and envisions them as the future of the (digital) economy. A reader & writer at heart, he calls himself an “average guitar player” and a fun footballer.


