
 Home
Home News
News
- 1 GRT price prediction is mildly bullish and suggests a sharp rise might be visible.
- 2 The Graph price took support at the 50-day EMA and showed a bounce.
- 3 GRT token price is marching toward the Year-till-date High.
GRT price prediction suggests a significant rise in its value is possible in the coming months. It rises upward by forming higher high swings and the presence of bulls is visible.

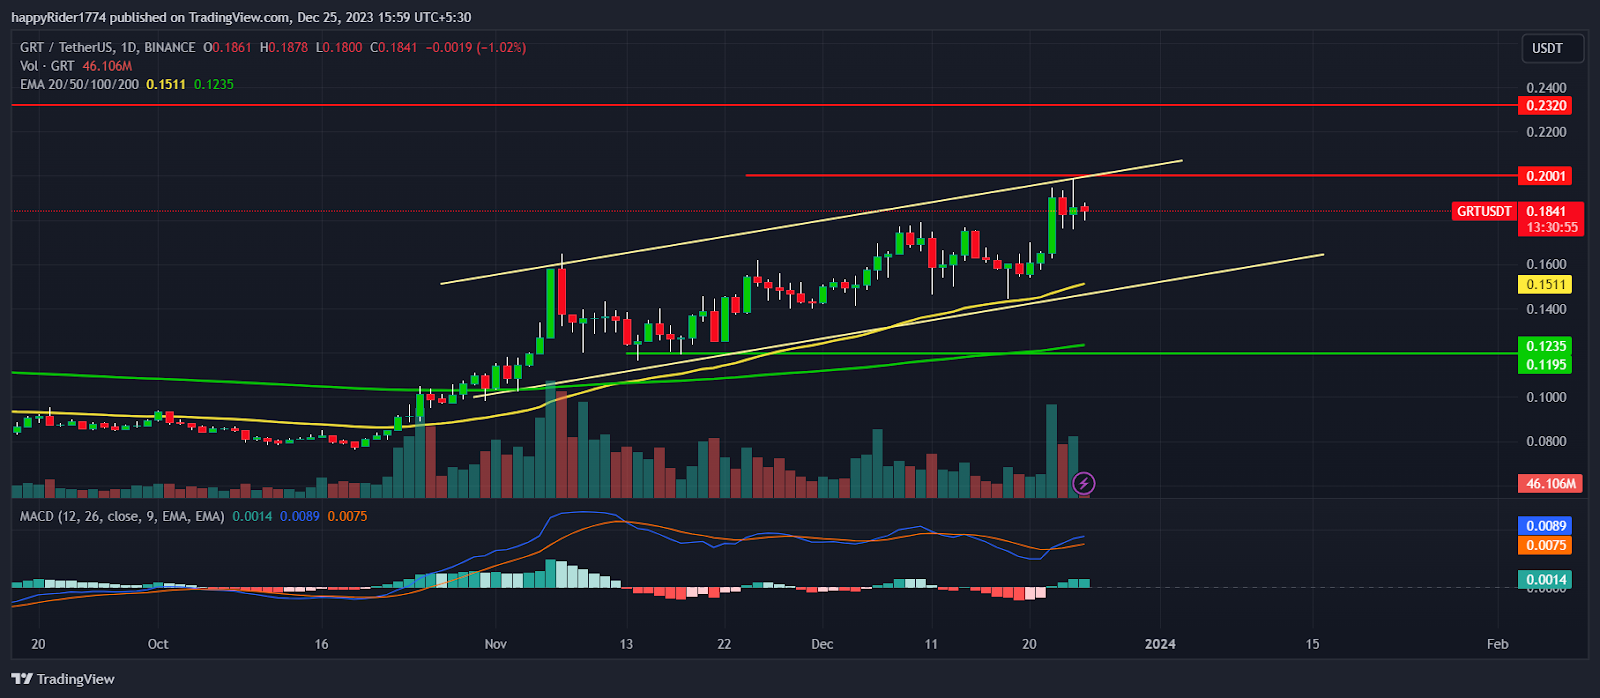
The Graph price is inside the upward-rising channel and buyers are successfully holding the higher levels. It took support near to the 50-day EMA and showed a decent bounce.
The chart pattern is bullish and the price is sustaining above the 50-day and 200-day EMAs, which showcases an uptrend. Meanwhile, GRT witnessed a massive spike in buying volume and the price also followed the same direction. It indicates that big players are slowly and steadily accumulating this token from the lower levels.
In the last two months, The Graph price performed well and rallied approximately 74% from the November low. The bulls are continuing their dominance and the price is marching toward the Year-till-date high placed at $0.2320.
Currently, the pair of GRT/USDT is trading at $0.1841 with an intraday downtick of 1.02%. In the last 24 hours, the trading volume increased by 24% and the volume to market cap ratio stands at 0.0727.
Will GRT Price Continue the Rally and Reward its Investors?
GRT price is in the bulls’ grip and rose 29% in the current month. The buyers look very aggressive and active as compared to the sellers. So, more scope for the upside is open.
If the buyers succeed in breaking out of the $0.2320 hurdle, a sharp rise of 20% to 25% is possible. As long as the Graph price holds the 50-day EMA, the possibility of the breakout will remain high.
The analysis suggests that genuine buyers are pushing the price higher so the rally may continue and reward its investors in the long run.
The Graph Price Analysis: Will the Buyers Give the Follow-Up?
The Graph price rose 17% in the last week and formed a giant bullish candle. However, it will be interesting to see whether the buyers can give the follow-up momentum or not.
The MACD curve displayed a positive crossover and sloping upward indicates that bullish momentum might continue. The supertrend says till the price holds the $0.1414 the trend will remain upward. The RSI at 64 pointing north denotes the strength of the bulls and more room for upside is open.
Conclusion
GRT price prediction favors the bulls and suggests a rise in the short run. The lower range of the channel is acting as a strong support. So, any short-term correction might get absorbed, and a bounce back is possible.
The analysis suggests that as long as the price holds the 50-day EMA, the probability of the breakout remains high.
Technical levels
- Resistance levels: $0.2200 and $0.2320
- Support levels: $0.1511 and $0.1235
Disclaimer
The views and opinions stated by the author, or any people named in this article, are for informational purposes only. They do not establish financial, investment, or other advice. Investing in or trading crypto assets comes with a risk of financial loss.

Adarsh Singh is a true connoisseur of Defi and Blockchain technologies, who left his job at a “Big 4” multinational finance firm to pursue crypto and NFT trading full-time. He has a strong background in finance, with MBA from a prestigious B-school. He delves deep into these innovative fields, unraveling their intricacies. Uncovering hidden gems, be it coins, tokens or NFTs, is his expertise. NFTs drive deep interest for him, and his creative analysis of NFTs opens up engaging narratives. He strives to bring decentralized digital assets accessible to the masses.


