
 Home
Home News
News
- 1 Theta Fuel’s crypto price is currently trading at $0.04792022 with a rise of 0.34% in the last 24 hours.
- 2 TFUEL has a current market cap of $309.167 Million.
- 3 Theta Fuel crypto is trading above the key moving averages showing strength on the charts.
Theta Fuel price has been trending upward in the last session and has maintained an upward trend above its 200-day EMA near the $0.4792 cluster in the bullish zone. The chart shows the current bullish momentum.
Moreover, the price action is favorable for buyers and the charts show continued growth activity. The price of Theta Fuel is on an upward trajectory towards $0.05766915, if it exceeds this the price will return to the high of $0.05766915. Conversely, the lower trajectory is near $0.04487193.
At press time, TFUEL was neutral, up by 0.34% intraday and trading at $0.04792022. Moreover, the 24-hour trading volume is $14.873 million. The market capitalization of TFUEL is $309.167 Million.
Technical Analysis of Theta Fuel Crypto Price in 1-D Timeframe
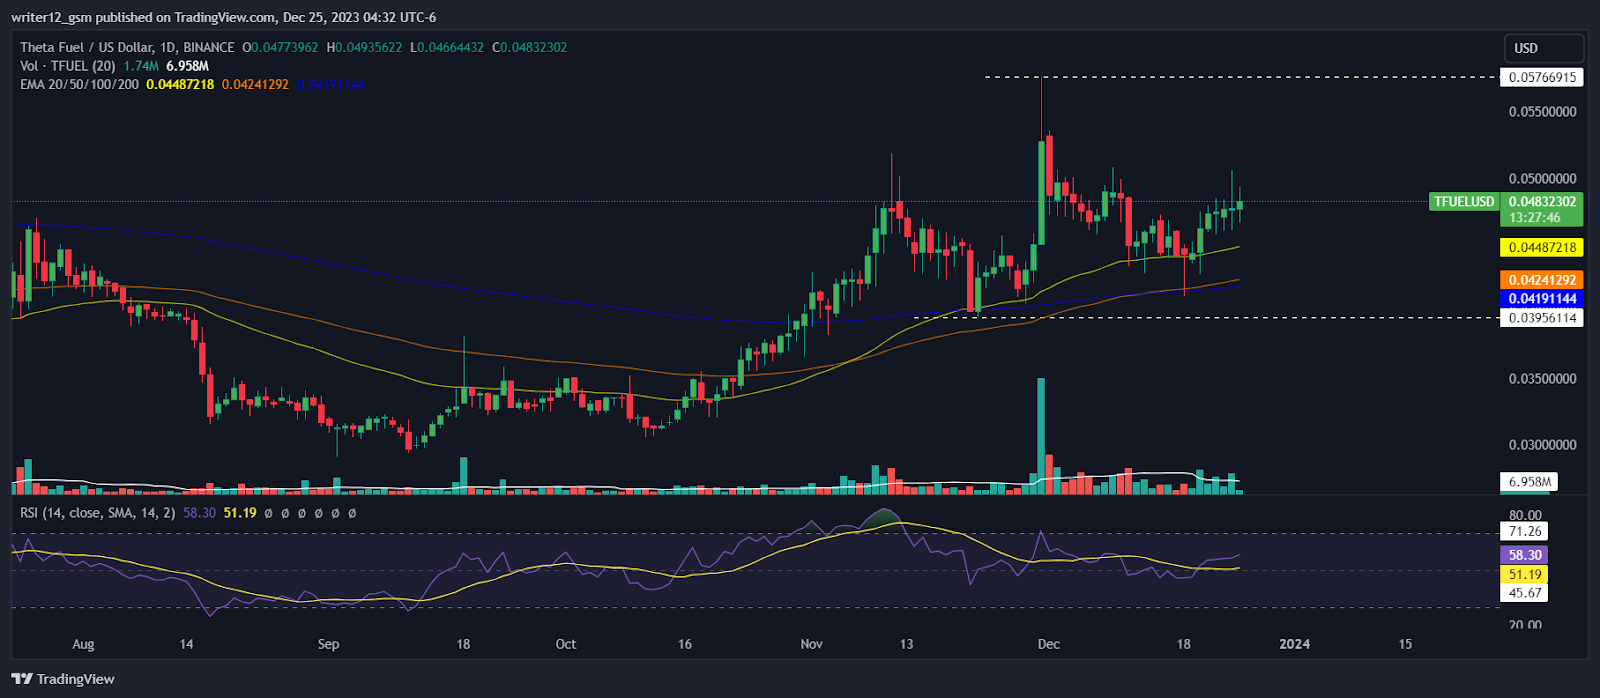
The Theta Fuel (USD: TFUEL) cryptocurrency is currently trading above its 50-day and 200-day daily moving average (dMA), which supports its price momentum.
The current RSI value is 58.30 points. The 14 SMA is above the center line at 51.19 points, indicating the bullish nature of the Theta Fuel cryptocurrency.
The MACD line at 0.00054651 and the signal line at 0.00038677 are above the zero line. There is a bullish crossover in the MACD indicator, which indicates strong momentum in the price of the TFUEL cryptocurrency.
Short-term price analysis on charts On the 4-hour chart.
Theta Fuel price trend is strong and buyers are trying to break the zone and hold above the key moving averages. The RSI curve is around 50, which is close to the neutral level, and price consolidation is forming a positive crossover, which contributes to the positive outlook on the chart. The MACD indicator has shown a bullish crossover, but the green bar is close to the end, indicating that a crossover is imminent. However, prices can be consolidated.
Summary
Technical oscillator Theta Fuel (USD: TFUEL) also supports the bullish trend. MACD, RSI, and EMA highlight positive signals, suggesting that the upward trend in the price of the TFUEL cryptocurrency may continue. Price action suggests investors and traders are optimistic daily. Price movements reflect the current optimistic outlook. However, investors and traders must wait to be properly prepared for the next step and avoid FOMO.
Technical Levels
Support Levels: $0.04487336 and $0.04191181.
Resistance Levels: 0.05766915.
Disclaimer
This article is for informational purposes only and does not provide any financial, investment, or other advice. The author or any people mentioned in this article are not responsible for any financial loss that may occur from investing in or trading. Please do your own research before making any financial decisions

Adarsh Singh is a true connoisseur of Defi and Blockchain technologies, who left his job at a “Big 4” multinational finance firm to pursue crypto and NFT trading full-time. He has a strong background in finance, with MBA from a prestigious B-school. He delves deep into these innovative fields, unraveling their intricacies. Uncovering hidden gems, be it coins, tokens or NFTs, is his expertise. NFTs drive deep interest for him, and his creative analysis of NFTs opens up engaging narratives. He strives to bring decentralized digital assets accessible to the masses.


