
 Home
Home News
News
- 1 Lisk crypto price decreased by 13.86% over the past month.
- 2 Lisk crypto price is currently trading at $1.121080 with a drop of 2.20% in the last 24 hours with a current market cap of $114.289 Million.
At the time of writing, the Lisk crypto trades with a significant weakness and intraday drop of 2.20%, indicating bearishness. Buyers are making efforts to gain traction in the market, but they are only able to secure a few critical levels of support. Intraday trading volume is 4.826 million. Moreover, the LSK crypto chart suggests following sessions will also show volatility.
The Lisk crypto is trading in a downtrend on the daily chart and has underperformed in the past months. Furthermore, the technical indicators continue to signal bearishness, with no signs of a bullish reversal as of now.
As per TradingView data, LISK crypto is volatile this year as it gave a 57.16% return year to date and soared by 42.71% in the last 6 months. Additionally, it gave a 54.72% return in the last 3 months and gave a 13.66% in the last month demonstrating recent weakness.
Technical Analysis of Lisk Crypto Price in 1-D Time Frame
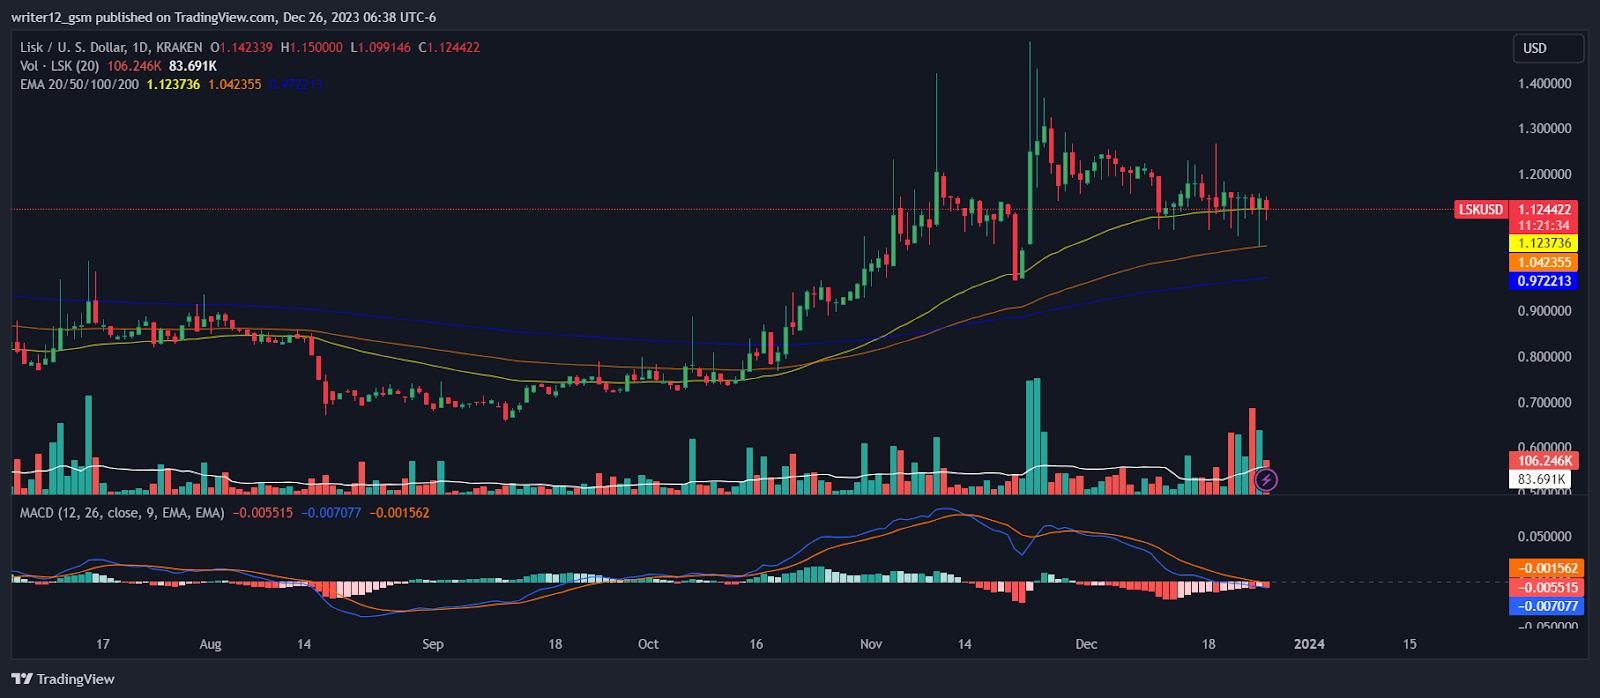
At the time of publishing, Lisk crypto (USD: LSK) is trading above the 50 and 200-day daily moving averages (DMAs), which are supporting the price trend.
However, if selling volume counts up then the price might conquer supporting DMA’s by making lower highs and lows. Therefore, the LSK price is expected to move downwards giving bearish views over the daily time frame chart.
The current value of RSI is 50 points. The 14 SMA is above the median line at which signals that the Lisk crypto is bearish.
The MACD line at -0.007215 and the signal line at -0.005625 are below the zero line. A bearish crossover was observed in the MACD indicator which signals more bearishness for the LSK crypto price.
On the 4-hour chart, the Lisk token is currently under the control of the sellers, and buyers are not able to surpass the range of neutrality. The price action indicates that sellers are persistently pushing back against the bulls below the $1.1200 trajectory, causing the gains from the top to erode.
The relative strength index (RSI) curve is near the neutral range of 50, indicating negative divergence and bearishness on the charts.
The MACD indicator also suggests a neutral signal, and both the moving averages converge, which suggests that a significant move can be shown in the upcoming sessions.
Summary
Lisk (USD: LSK) technical oscillators support the mild bearish momentum. The MACD, RSI, and EMA are emphasizing neutral signs and imply that the downtrend may continue in the LSK crypto price. Lisk price action suggests that the investors and traders are bearish on the 1-D time frame. The price action reflects a bearish perspective at the moment.
Technical Levels
Support Levels: $1.0423.
Resistance Levels: $1.2812.
Disclaimer
This article is for informational purposes only and does not provide any financial, investment, or other advice. The author or any people mentioned in this article are not responsible for any financial loss that may occur from investing in or trading. Please do your own research before making any financial decisions

With a background in journalism, Ritika Sharma has worked with many reputed media firms focusing on general news such as politics and crime. She joined The Coin Republic as a reporter for crypto, and found a great passion for cryptocurrency, Web3, NFTs and other digital assets. She spends a lot of time researching and delving deeper into these concepts around the clock, and is a strong advocate for women in STEM.


