
 Home
Home News
News
- 1 XLM price slowly & steadily healed from the lows of $0.1000 in the past few sessions.
- 2 XLM price is likely to scratch the resistance mark of $0.1400 soon.
XLM price action plotted an ascending triangle pattern on the chart. However, the neckline of the triangle pattern still needs to be breached, and buyers are trying to surpass the hurdle. Moreover, the XLM price is holding the gains on the 20-day EMA and is pausing the bullish moves.
XLM price is trading close to the neutral trajectory and is below the supply zone of $0.1500, replicating consolidation on the charts. However, buyers did not exit their positions and were still looking to extend the pullback to retest the swing high of $0.1500. Nonetheless, sellers have maintained their grip tightly and did not permit bulls amid multiple attempts. Per the Fibonacci retracement levels, XLM price has surpassed the 38.2% zone and is close to the 50% zone.
The live price of XLM crypto is $4.71, with an intraday drop of 2.23%, showing neutrality on the chart. Moreover, the trading volume increased by 2.89% to $103.52 Million. However, the pair of XLM/BTC is at 0.0000300 BTC, and the market cap is $2.59 Billion. Analysts have maintained a bullish rating, suggesting the outperformance will continue in the following sessions.
Daily Chart Show Narrow Range Moves
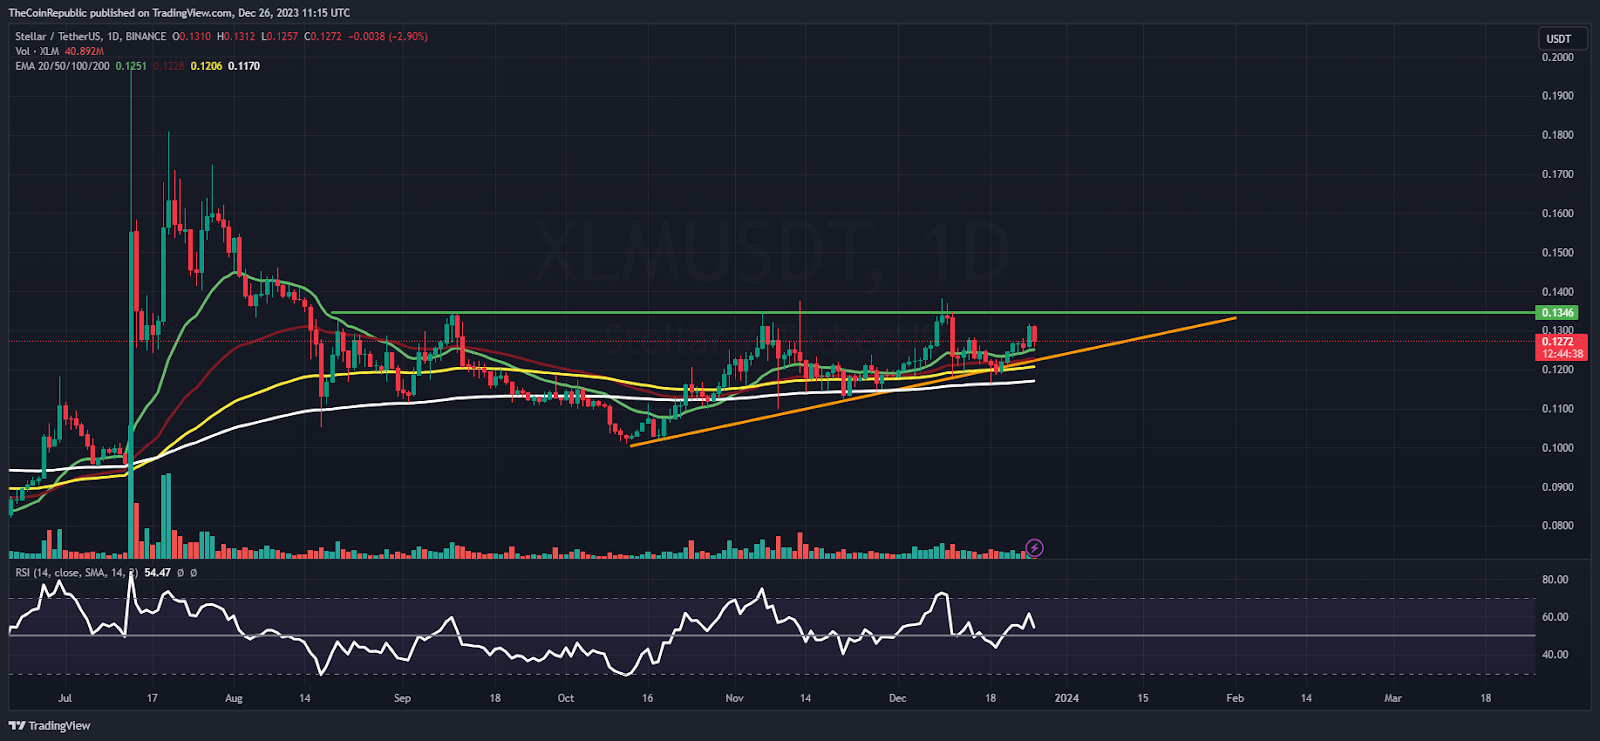
On the daily charts, XLM price showcased a higher high formation and did its correction in the recent sessions. Moreover, the technicals suggest that if XLM price succeeds in escaping the trajectory hurdle of $0.1500, a sharp bull move is expected to scratch the upside of $0.1800 soon.
The relative strength index (RSI) curve stayed near the midline, showcasing a neutral projection on the charts. The MACD indicator showed a convergence of the MA line with the signal line, showing neutrality on the charts.
Weekly Chart Exhibits Rounding Bottom Formation
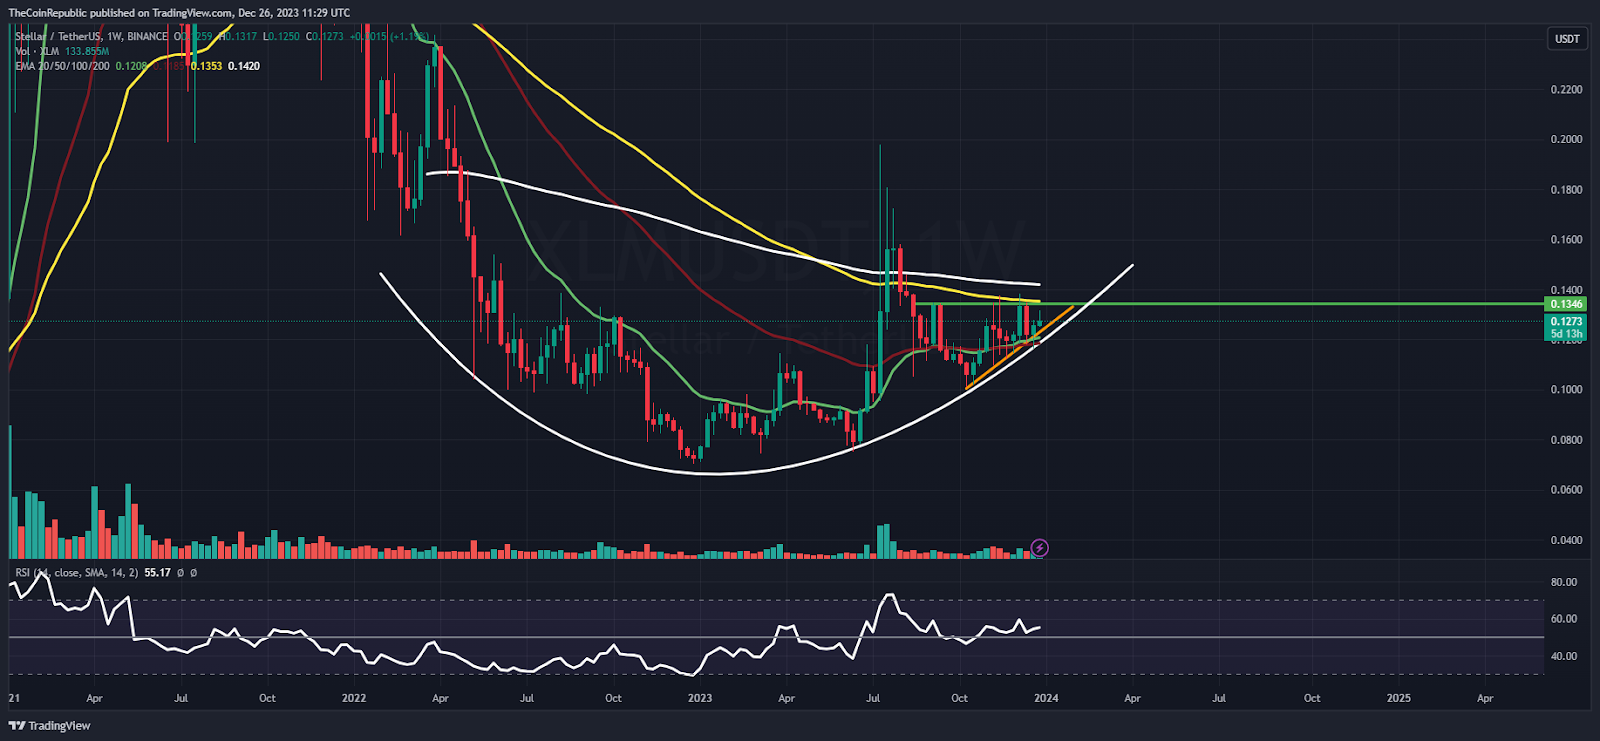
On the weekly chart, XLM price rebounded, formed a rounding bottom pattern in the recent sessions, and delivered buyers accumulation for the past sessions. Moreover, the price action showcased the bulls’ intention to take the XLM price beyond the key moving averages to execute fresh rally.
Summary
XLM price is trying to escape the neckline hurdle of $0.1400 of the ascending triangle pattern and is holding the gains. Moreover, the price action displays the buyers accumulation and higher high formation was noted on the chart. The RSI and the MACD gave neutral signals.
Technical Levels
Support Levels: $0.1150 and $0.1000
Resistance Levels: $0.1360 and $0.1500
Disclaimer
The views and opinions stated by the author or any other person named in this article are for informational purposes only and do not constitute financial, investment, or other advice. Investing in or trading crypto or stocks comes with a risk of financial loss.

Adarsh Singh is a true connoisseur of Defi and Blockchain technologies, who left his job at a “Big 4” multinational finance firm to pursue crypto and NFT trading full-time. He has a strong background in finance, with MBA from a prestigious B-school. He delves deep into these innovative fields, unraveling their intricacies. Uncovering hidden gems, be it coins, tokens or NFTs, is his expertise. NFTs drive deep interest for him, and his creative analysis of NFTs opens up engaging narratives. He strives to bring decentralized digital assets accessible to the masses.


