
 Home
Home News
News
- 1 ADA price retained the bullish territory and is reflecting an uptrend.
- 2 A golden crossover was formed and follow on buying spotted on the chart.
ADA price has approached the bullish trajectory and produced a bullish flag pattern on the chart. Moreover, the price action showcased higher high swings and reminisced outperformance for the past sessions. ADA price has surpassed the key moving averages and is ready to reach the blue sky zone above $0.7000. The technicals conveyed the bullish momentum and accomplished a revitalized trend reversal in the recent sessions.

ADA price is trading close to the 20-day EMA and displayed an uptrend in recent sessions. Amid the positive market sentiments in the crypto market, ADA coin participated in the rally and was among the top gainers over the past weeks. Per the technicals, ADA price action shows a bullish stance and delivers a trend reversal on the chart.

The live price of Cardano (ADA) is $0.0621, with an intraday drop of 4.51%, showing neutrality on the chart. Moreover, the trading volume increased by 4.47% to $944.84 Million. However, the pair of ADA/BTC is at 0.0000145 BTC, and the market cap is $22.70 Billion. Analysts have maintained a bullish rating, suggesting that ADA price will reach $0.7000 soon.
ADA on Daily Chart Displays Bullish Flag Pattern
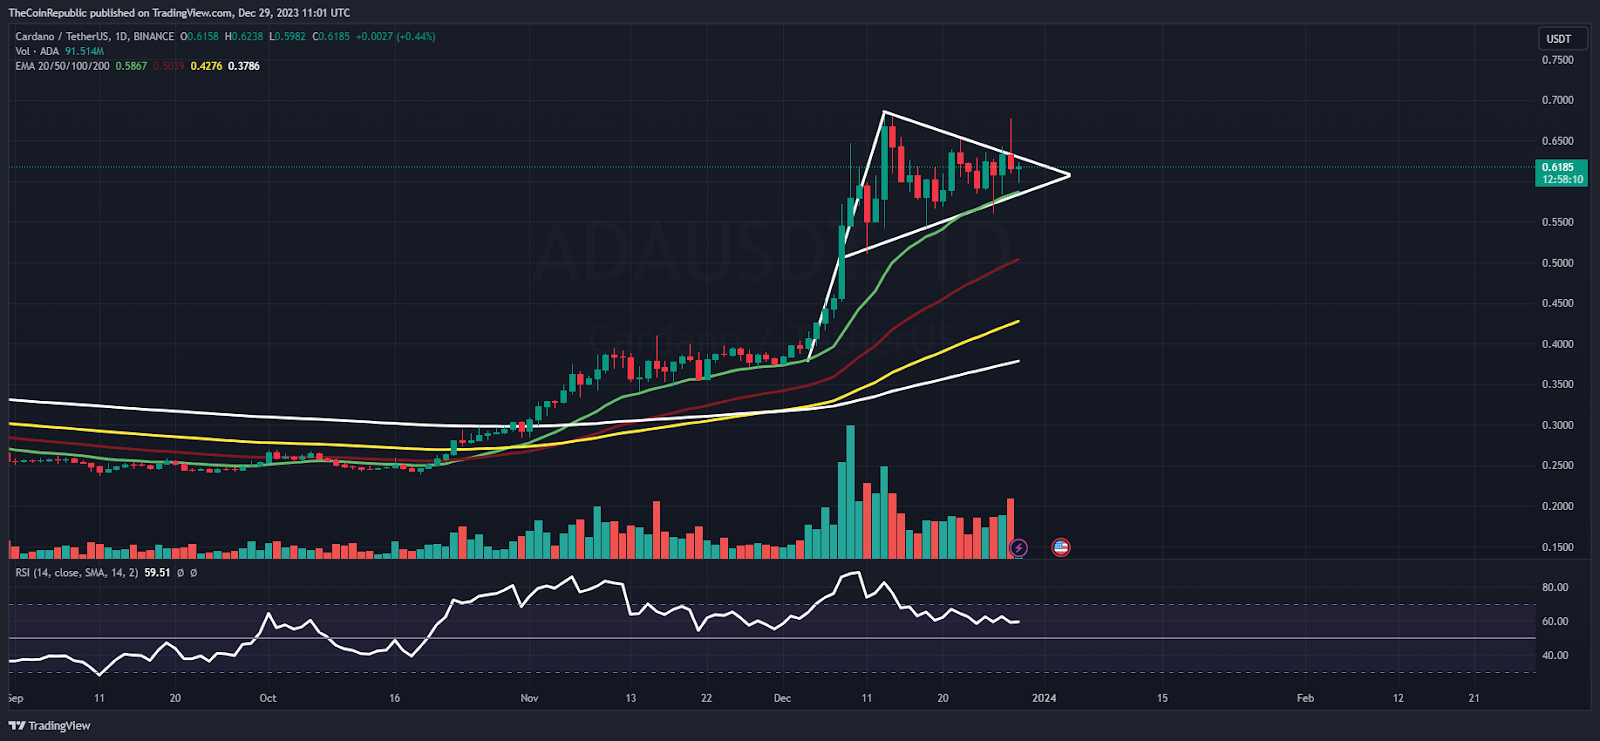
On the daily chart, ADA price pictured a bullish flag pattern and has shown a bullish stance in recent sessions. Moreover, the price action showcased the bullish bias and indicated that the ADA coin is likely to hit the $12 mark.
The relative strength index (RSI) curve stayed in the overbought zone and formed a negative crossover, displaying a profit booking on the charts. The MACD indicator shows a convergence with the MA line, with the signal line confirming a volatile outlook for the following sessions.
Weekly Charts Double Bottom Pattern Breakout
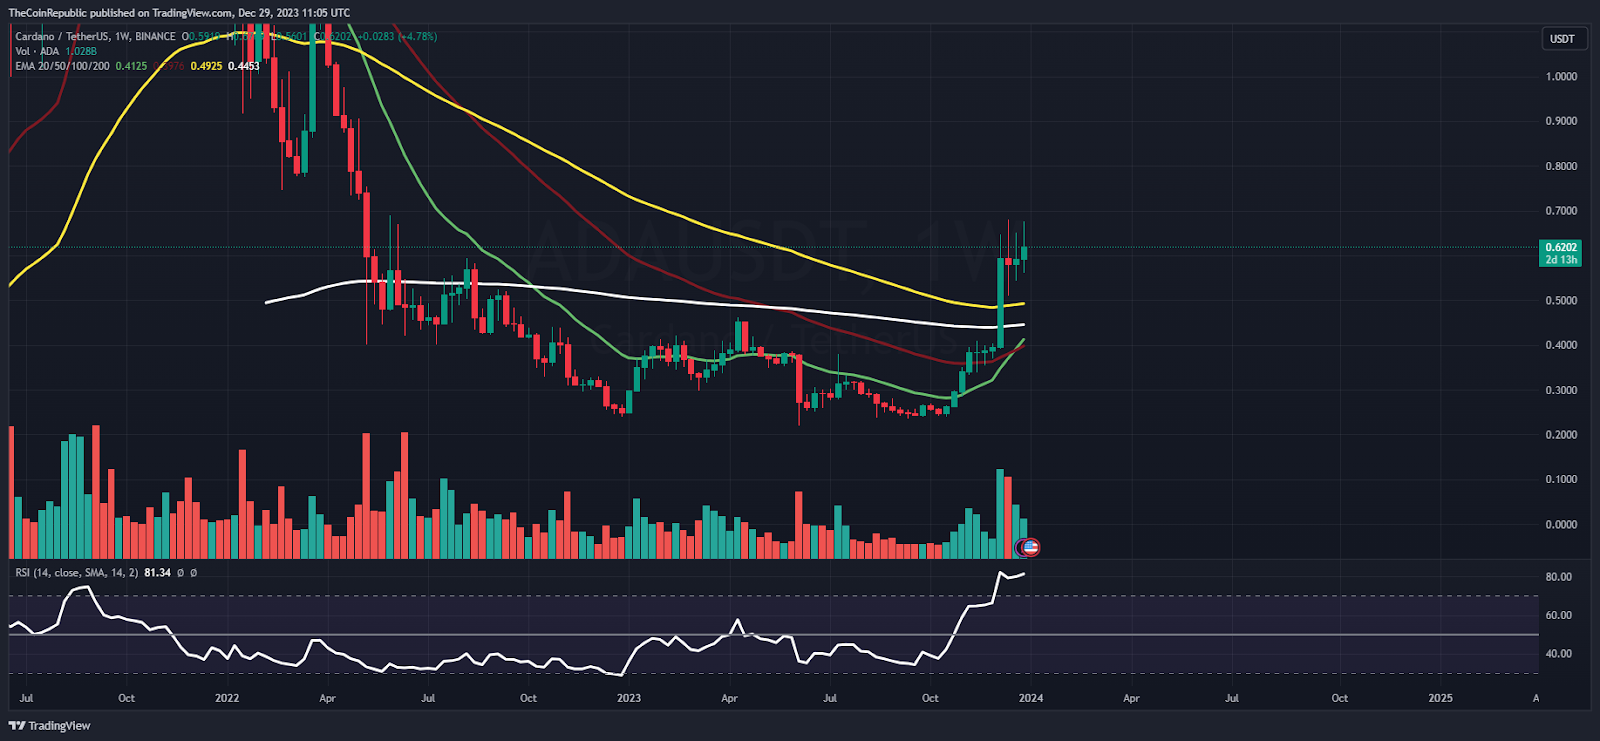
On the weekly chart, ADA price has ascended above the 200-day EMA mark and broke out from the double bottom pattern in recent sessions. Moreover, the price action reflects the buyers’ accumulation as investors have persisted in putting efforts and lifted the price decisively.
Summary
ADA price illustrated a monumental comeback and is lifting the gains above the neutrality, highlighting bulls’ dominance on the chart. Furthermore, the price action showcased the follow-on buying, and ADA price is still in the mid zone and has more to attain above $0.7000.
Technical Levels
Support Levels: $0.6000 and $0.5800
Resistance Levels: $0.6400 and $0.6600
Disclaimer
The views and opinions stated by the author or any other person named in this article are for informational purposes only and do not constitute financial, investment, or other advice. Investing in or trading crypto or stocks comes with a risk of financial loss.

Amanda Shinoy is one of the few women in the space invested knee-deep in crypto. An advocate for increasing the presence of women in crypto, she is known for her accurate technical analysis and price prediction of cryptocurrencies. Readers are often waiting for her opinion about the next rally. She is a finance expert with an MBA in finance. Quitting a corporate job at a leading financial institution, she now engages herself full-time into financial education for the general public.


