
 Home
Home News
News

- 1 AXS price persisted in delivering buying projections and is reflecting an uptrend.
- 2 Buyers are gaining traction and trying to skyrocket above the $10 mark.
AXS price has overtaken the trendline of the rising parallel channel and signals a breakout in recent sessions. However, the AXS price failed to extend the gains and faced rejection near $10. It will retest the channel’s support region near the 20-day EMA mark. Moreover, the trend is strong, and further short covering may be possible. AXS price may shift the upward movement above $12 soon.
AXS price is trading above the key moving averages and has decisively sustaining gains in the bullish territory reflecting the bulls dominance for the past sessions. Furthermore, the price action showcased the follow-on buying move, and higher high swings were spotted on the charts. The technicals reflect strong performance, and AXS price has reverted from the demand zone of $4 and surged over 130% in the recent sessions.

The live price of Axie Infinity (AXS) is $9.45, with an intraday gain of 1.08%, showing neutrality on the chart. Moreover, the trading volume increased by 25.47% to $162.53 Million. However, the pair of AXS/BTC is at 0.0000246 BTC, and the market cap is $582.90 Million. Analysts have maintained a bullish rating, suggesting that volatility will continue in the following sessions.
Daily Chart Displays Rising Parallel Channel
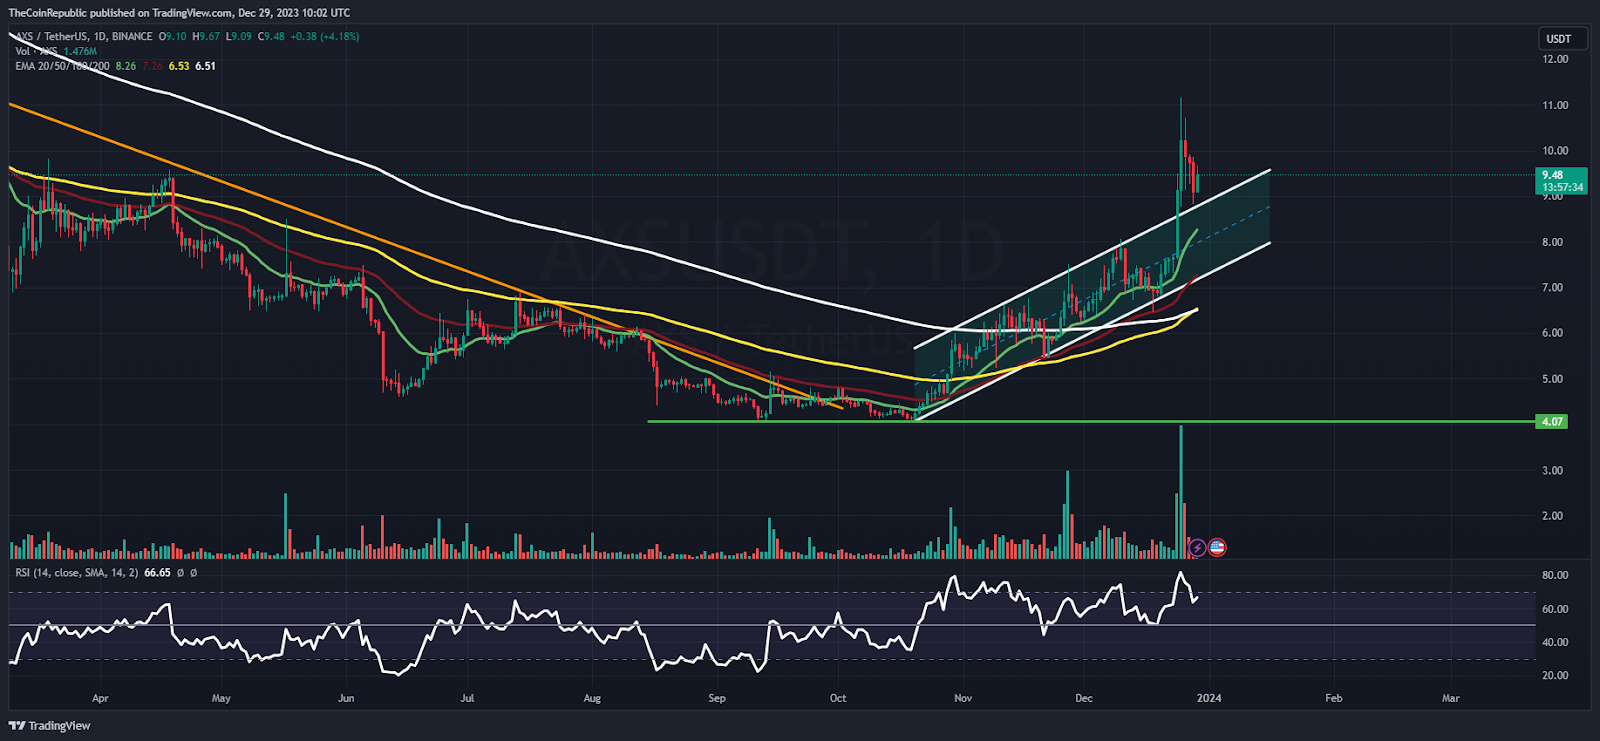
On the daily chart, AXS price showcased bullish momentum and has persisted in gaining traction in the past few sessions. Moreover, the price action depicts buyers’ accumulation, and the AXS token was lifting the gains amid the positive global sentiments. Per the Fibonacci retracement levels, AXS token has sustained above the 50% zone and is beyond the mid bollinger band.
The relative strength index (RSI) curve stayed in the overbought zone and formed a positive divergence, suggesting that the AXS token may continue to lift gains. The MACD indicator shows a bullish crossover and ensured green bars on the histogram, suggesting excellent performance in the following sessions.
Weekly Chart Reflects V-Shaped Reversal
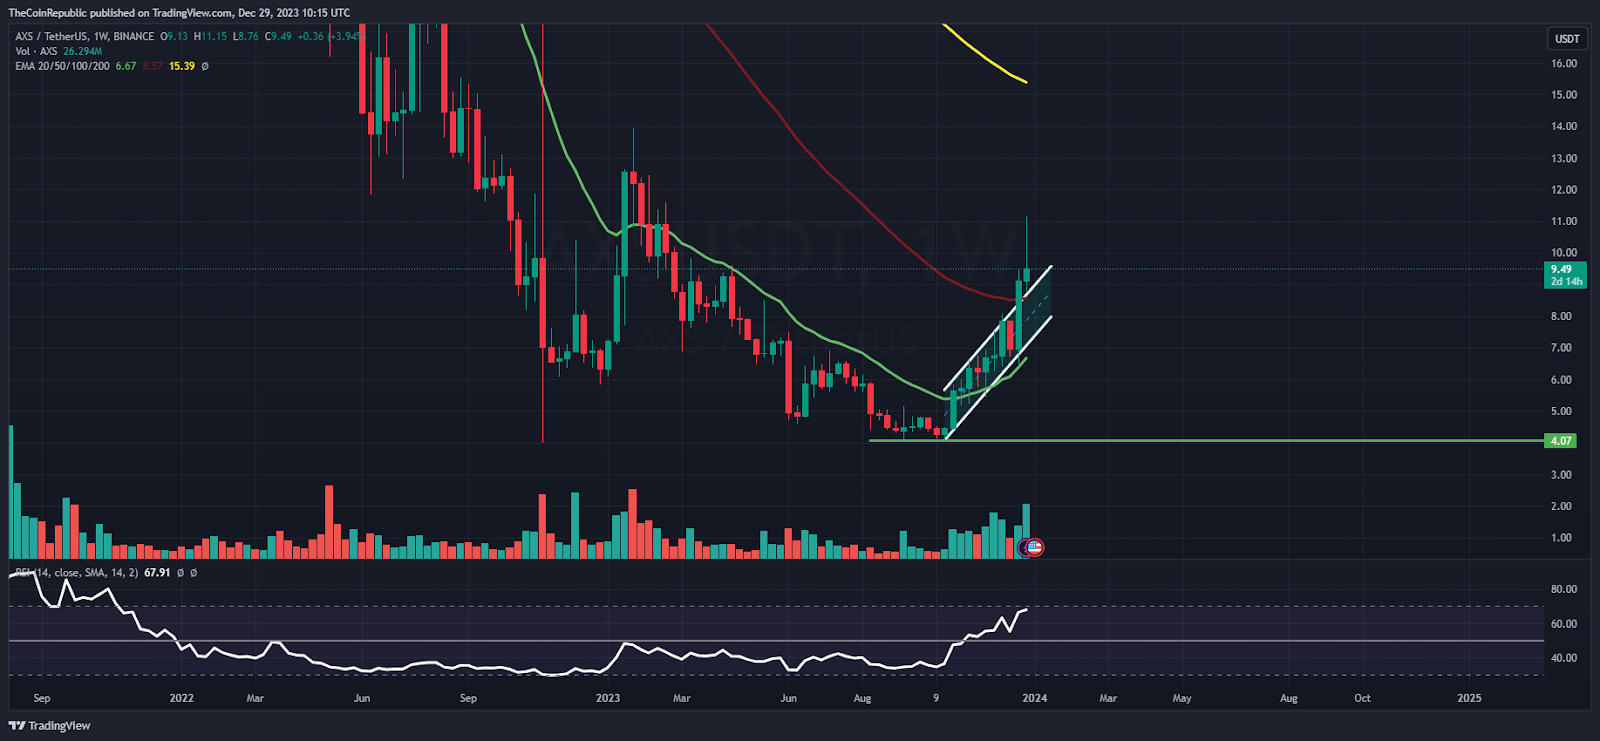
On the weekly chart, AXS price reverted from the bottom zone, displayed a V-shaped reversal, and is heading toward the 100-day EMA mark near $15. Furthermore, the AXS token has decisively surpassed the 20- and 50-day EMAs, highlighting the bullish momentum in recent sessions.
Summary
AXS price has surpassed the trendline barrier of the rising parallel channel and displays a breakout on the chart. Moreover, the price action shows the higher highs formation and signifies the bulls’ dominance in the past sessions.
Technical Levels
Support Levels: $9.20 and $9
Resistance Levels: $10 and $10.30
Disclaimer
The views and opinions stated by the author or any other person named in this article are for informational purposes only and do not constitute financial, investment, or other advice. Investing in or trading crypto or stocks comes with a risk of financial loss.

Adarsh Singh is a true connoisseur of Defi and Blockchain technologies, who left his job at a “Big 4” multinational finance firm to pursue crypto and NFT trading full-time. He has a strong background in finance, with MBA from a prestigious B-school. He delves deep into these innovative fields, unraveling their intricacies. Uncovering hidden gems, be it coins, tokens or NFTs, is his expertise. NFTs drive deep interest for him, and his creative analysis of NFTs opens up engaging narratives. He strives to bring decentralized digital assets accessible to the masses.


