
 Home
Home News
News
- 1 Despite some bearish indications, DASH crypto price is currently trading above the key moving averages.
- 2 DASH crypto price increased by 8.37% over the past seven days.
The crypto price of DASH (USD: DASH) shows signs of mild bearishness, losing the gains it made below the key moving averages. DASH crypto had a brief breakout above the $35 trendline, but it was short-lived as the price was pushed down by the bears. The buyers failed to maintain the momentum and started to exit their positions, resulting in a decline in the crypto price.
DASH crypto has been in an uptrend for the past number of months, forming higher highs and higher lows patterns, and facing resistance from the upper trendline, which prevented it from breaking out. The price action indicates that DASH crypto has been under selling pressure, and the buyers have been passive. However, the overall trend is bullish as of now.
At press time, DASH crypto was trading at $34.76 with an intraday loss of 5.77% showing bearishness on the charts. Moreover, the intraday trading volume is 92.291 Million. The market cap of DASH crypto is 405.717 Billion.
Over the span of a week, DASH crypto has experienced an increase of approximately 8.37%, and this incline has been seen in the course of a month also, reaching around 16.42%. Looking back over a three-month period, Dash cryptos have risen by about 27.82%, with a decline of around 8.24% over the last six months. Furthermore, the crypto’s performance throughout the year has been lackluster, with a year-to-date slump of approximately 16.76%.
Technical Analysis of DASH Crypto Price in 1-D Time Frame
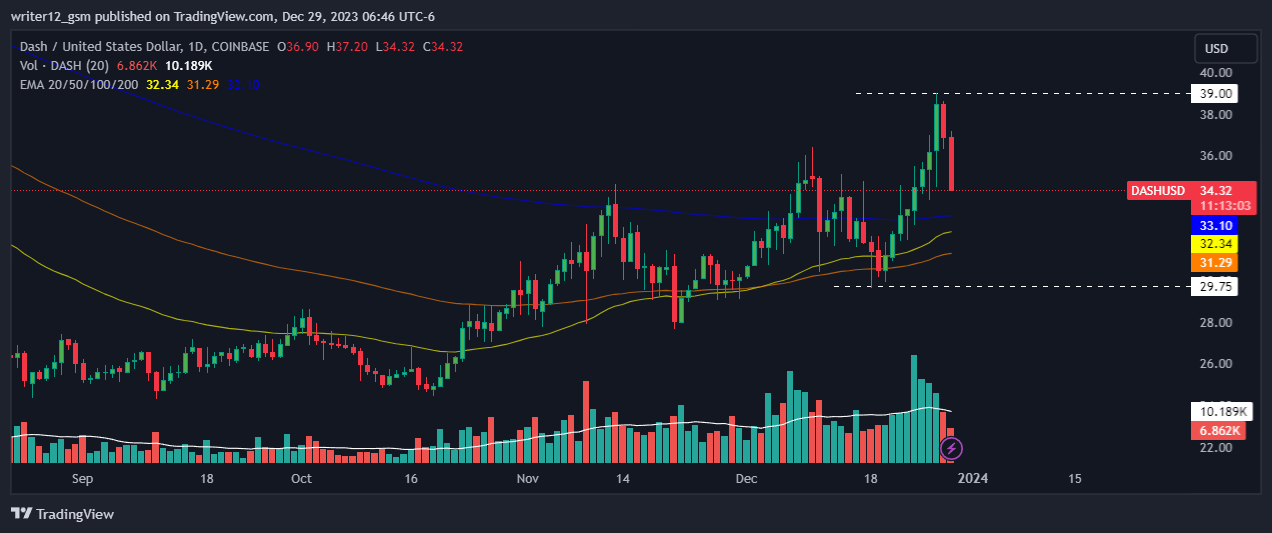
DASH crypto is currently trading above the 50-day and 200-day DMAs, which are providing support for the price trend. However, if selling pressure increases, the price could break below these DMAs and move lower.
The RSI indicator is currently at 53.03, which is in the neutral zone. However, the 14-day SMA is above the RSI curve, which is a bearish signal.
The MACD indicator is in the bullish zone, with the MACD line trading above the signal line. This indicates that the DASH crypto is bullish as of now. Overall, the technical indicators suggest that DASH crypto is bearish in the short term. However, if it can maintain the $40 level, it could continue to rise in the long term.
Summary
DASH (USD: DASH) technical oscillators also support the mild bearish trend. The MACD, RSI, and EMAs are emphasizing neutral signs and imply that the uptrend may continue in the DASH crypto price. DASH price action suggests that the investors and traders are bullish on the 1-D time frame. The price action reflects a bullish perspective at the moment.
Technical Levels
Support Levels: $29.75.
Resistance Levels: $39.00.
Disclaimer
This article is for informational purposes only and does not provide any financial, investment, or other advice. The author or any people mentioned in this article are not responsible for any financial loss that may occur from investing in or trading. Please do your own research before making any financial decisions.
Steve Anderson is an Australian crypto enthusiast. He is a specialist in management and trading for over 5 years. Steve has worked as a crypto trader, he loves learning about decentralisation, understanding the true potential of the blockchain.


