
 Home
Home News
News
- 1 Trust Wallet Token is currently trading at $1.29916274 with a gain of 2.06% and a market cap of 541.296 Million.
- 2 TWT took a pause after a good surge and gave a return of 7.97% this week.
TWT is trading at $1.29916274 with a volume of 24.062 Million. This company has a market cap of 541.296 Million fully diluted market cap is 1.299 Billion. The circulating supply is 416.65 Million.
The crypto gave a return of -8.45% to its investors since the beginning of the year. The TWT gave a return of 48.17% in the previous 6 months and gave a 66.38% return in the last 3 months. Additionally, it gave a return of 14.74% last month and grew by 7,97% last week.

However, recently, the crypto has shown signs of weakness, as it failed to break above the resistance level of $1.82723. The TWT crypto is also taking multiple support on key EMAs and bouncing back indicating failed bears’ attempt to pull the price down.
As per TradingView, out of 26 indicators,2 are on the sell side, 9 are on the neutral side, and 15 of them indicate a buy signal. However, the overall weightage of indicators is on the buy side.
TWT Crypto Technical Analysis
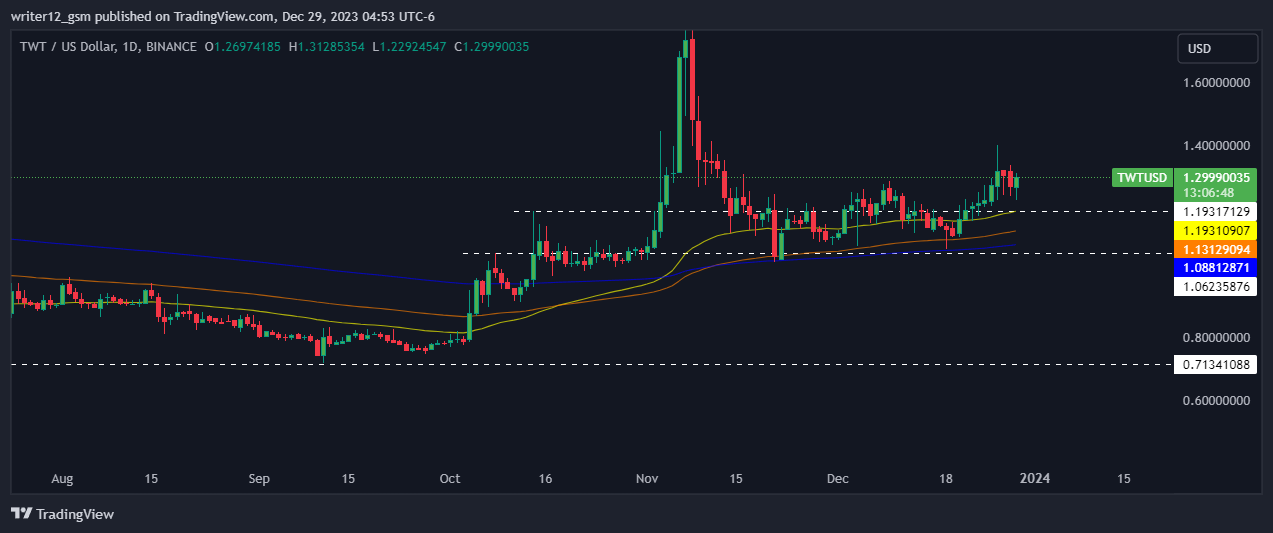
According to the technical chart, TWT took support from the lower trendline of $1.06235876 and bounced back. Moreover, the price was currently heading toward the upper trendline of $1.40285936.
MACD breached the middle line and is headed upwards. MACD line (0.02836366) is beyond the signal line (0.01500996), demonstrating bullishness in the crypto.
The RSI line is also heading towards an overbought zone, breaching the median line. The RSI line (60.69) is beyond the 14 SMA (54.00) line demonstrating bullishness.
On the 4-hour chart, Trust Wallet Token crypto is on the verge of a most awaited breakout, which registers when the price trades above $1.40285936. Moreover, buyers are accumulating and trying to breach upper levels.
RSI shows the buyers’ presence. The RSI curve is floating near 54, which indicates that the crypto is near the overbought zone. This could be a sign that sellers are starting to lose control of the crypto. However, the RSI is still close to the neutral zone, so it is too early to say that a breakout is likely.
Conclusion
Trust Wallet Token crypto price is heading upwards, breaking the 50-Day EMA and towards 200-Day EMA. The technical indicators including MACD and RSI are indicating an uptrend on the TWT price chart. Trust Wallet Token investors avoid the FOMO (fear of missing out). Scarcity is created in the crypto market for accumulating more investors and creditors.
Technical Levels
Support Level: $1.06235876.
Resistance Levels: $1.40285936.
Disclaimer
This article is for informational purposes only and does not provide any financial, investment, or other advice. The author or any people mentioned in this article are not responsible for any financial loss that may occur from investing in or trading. Please do your own research before making any financial decisions.

Steefan George is a crypto and blockchain enthusiast, with a remarkable grasp on market and technology. Having a graduate degree in computer science and an MBA in BFSI, he is an excellent technology writer at The Coin Republic. He is passionate about getting a billion of the human population onto Web3. His principle is to write like “explaining to a 6-year old”, so that a layman can learn the potential of, and get benefitted from this revolutionary technology.


