
 Home
Home News
News

- 1 FTX crypto price was trading at $3.56597591 at press time, showing a 19.71% rise in the last 24 hours with a current market cap of $1.185 Billion.
- 2 Technical indicators suggest the bounce back of FTX crypto.
FTX crypto price is facing strong bullish pressure on the daily technical charts, as it is trading above the 50 and 100-day EMA. The crypto successfully broke above its key resistance levels and took a pullback, despite several bearish attempts by sellers.

The crypto is currently trading near 200 EMA, with a marginal gain of 19% in the intraday session. The crypto has a potential upside target of $4.00, but it needs to overcome the bears and surge above the 200-day EMA. The crypto has a support level of $2.949088, which could prevent further downside.

The crypto is slipping from the firm grip of the bears but needs to show some signs of reversal before a bullish trend can be confirmed.
The technical indicators favor the bulls projecting an optimistic perspective for the buyers. RSI and stochastic RSI oscillators are moving near the overbought zone whereas the major EMA lines act as supports for FTT coin price.
The token’s performance has been good throughout the year. It gave positive returns of 327.07% in the year-to-date period, 116.84% in the last six months,221 % in the last three months, and 0.11% in the last week. This shows a persistent bullish trend that has not reversed yet.
Technical Analysis of FTX Crypto Price in 1-D Time Frame
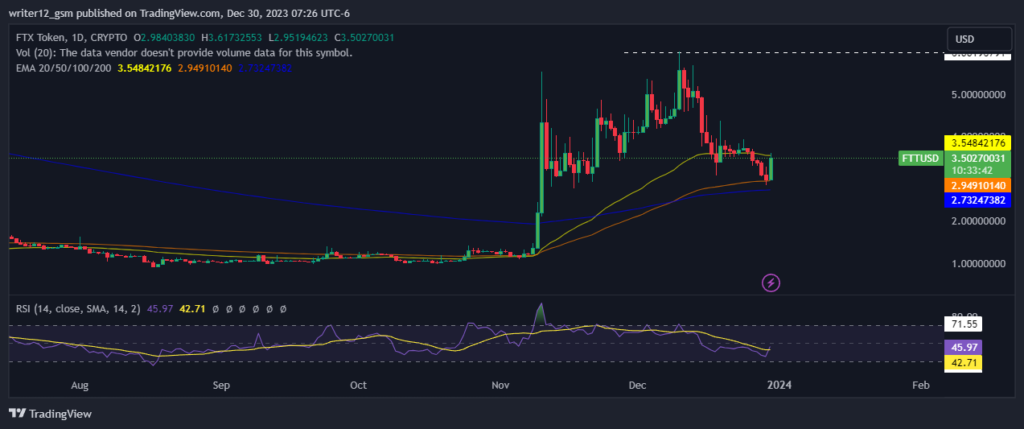
FTX crypto (USD: FTT) is trading between the 100 and 200-day daily moving averages (DMAs), which are not upholding the price trend.
The current value of RSI is 46.09 points. The 14 SMA is above the median line at 42.72points which indicates that the FTX crypto is neutral.
The MACD line at -0.20679774 and the signal line at -0.11490158 are below the zero line. A bullish crossover is expected in the MACD indicator. MACD signals neutrality for the FTT crypto price.
Weekly-Time Horizon Analysis
The weekly charts of FTX crypto reveal that the sellers have been dominant. The crypto has been rejected from 200 EMA. However, the technical indicators are in the bullish zone. These signals indicate that the crypto may attempt more upside moves in the coming weeks.
Summary
FTX (USD: FTT) technical oscillators support the bullish trend. The MACD, RSI, and EMAs are emphasizing neutral signs and imply that the uptrend may continue in the FTT crypto price. FTX price action suggests that the investors and traders are bullish on the 1-D time frame. The price action reflects a bullish perspective at the moment.
Technical Levels
Support Level: $2.73206835
Resistance Level: $6.00196791
Disclaimer
This article is for informational purposes only and does not provide any financial, investment, or other advice. The author or any people mentioned in this article are not responsible for any financial loss that may occur from investing in or trading. Please do your own research before making any financial decisions.
Anurag is working as a fundamental writer for The Coin Republic since 2021. He likes to exercise his curious muscles and research deep into a topic. Though he covers various aspects of the crypto industry, he is quite passionate about the Web3, NFTs, Gaming, and Metaverse, and envisions them as the future of the (digital) economy. A reader & writer at heart, he calls himself an “average guitar player” and a fun footballer.


