
 Home
Home News
News
- 1 KAVA crypto price increased by 5.22% over the past seven days.
- 2 KAVA crypto price is currently trading at $0.9309 with a gain of 1.74% in the last 24 hours with a current market cap of $1.006 Billion.
The KAVA crypto continues to exhibit strength on the charts, with buyers exerting significant pressure in recent trading sessions. Furthermore, the chart structure favors the bulls, and the price continues to form positive candles, which shows a fight between bears and bulls.
At the time of writing, the KAVA crypto price was $0.9309 with an intraday gain of 1.74%, highlighting bullishness. Sellers are making efforts to gain traction in the market, but they were only able to secure a few critical levels.
Intraday trading volume also increased and the previous 24 volumes were 30.983 Million. Moreover, the KAVA crypto suggests further volatility in the following sessions.
The KAVA crypto is trading in an uptrend on the daily charts and has shown good performance in the past months. Furthermore, the technical indicators continue to signal bullishness, with no signs of a bearish reversal.
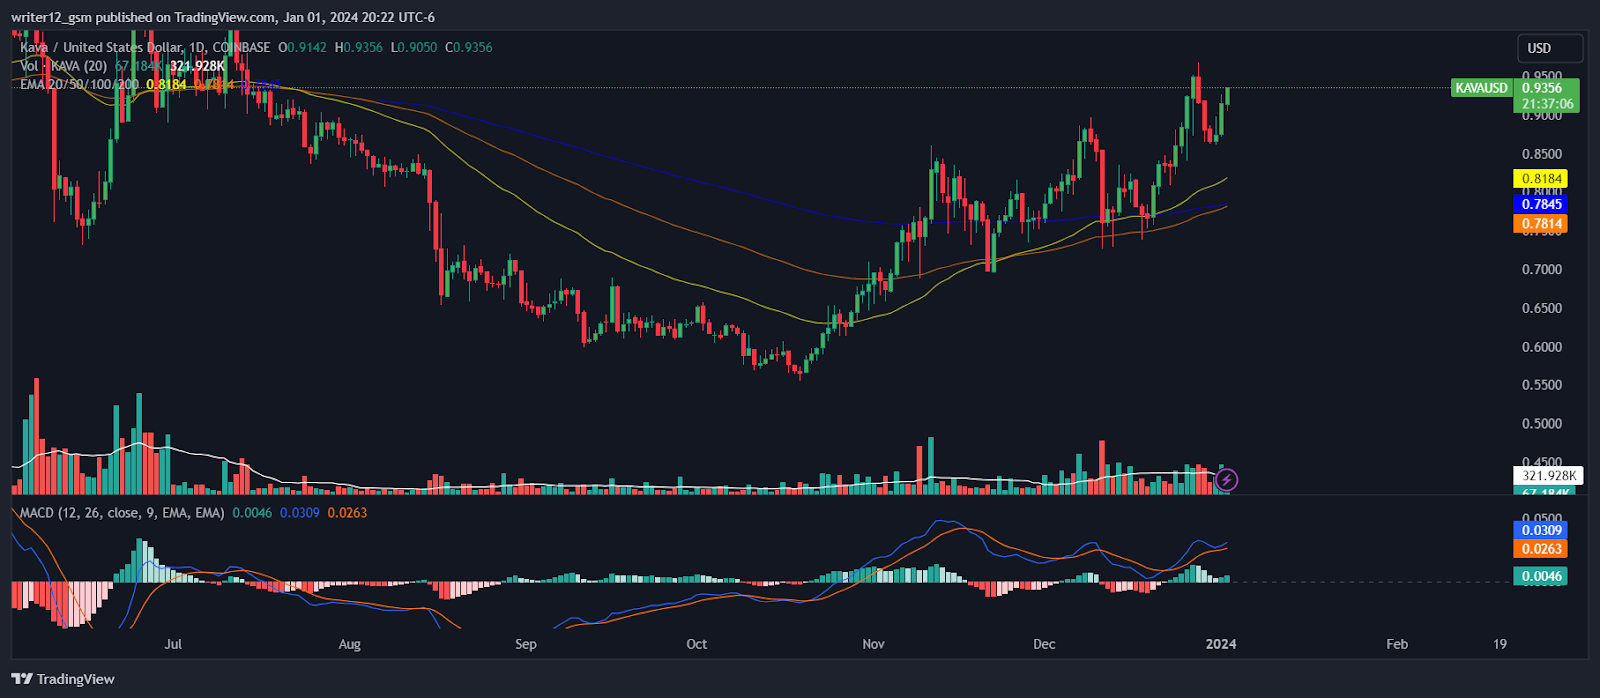
Technical Analysis of KAVA Crypto Price in 1-D Time Frame
On the 4-hour chart, the KAVA token is currently under the control of the buyers, and sellers were not able to drop the price below the range of neutrality. The price action indicates that buyers are persistently pushing back against the sellers, indicating bullishness.
The relative strength index (RSI) curve is above the neutral range of 50, indicating positive divergence and bullishness on the chart. The MACD indicator also suggests a bullish signal, and both the moving averages converge, which suggests that a significant move can be seen in the upcoming sessions.
At the time of publishing, KAVA crypto (USD: KAVA) is trading above the 50 and 200-day daily moving averages (DMAs), which support the price trend.
Moreover, if the selling volume adds up, then the price might conquer supporting SMAs by making lower highs and lows. However, the KAVA price is expected to move upwards giving bullish views over the daily time frame chart.
The MACD line at 0.0306 and the signal line at 0.0262 are above the zero line. A bullish crossover is observed in the MACD indicator which signals more bullishness for the KAVA crypto price.
The current value of RSI is 63.78 points. The 14 SMA is above the median line at 60.65 points which indicates that the KAVA crypto is bullish.
Summary
KAVA (USD: KAVA) technical oscillators support the bullish trend. The MACD, RSI, and EMAs are emphasizing positive signs and imply that the uptrend may continue in the KAVA crypto price. KAVA price action suggests that the investors and traders are bullish on the 1-D time frame. The price action reflects a bullish perspective at the moment.
Technical Levels
Support Level: $0.8184.
Resistance Levels: $0.9600.
Disclaimer
This article is for informational purposes only and does not provide any financial, investment, or other advice. The author or any people mentioned in this article are not responsible for any financial loss that may occur from investing in or trading. Please do your own research before making any financial decisions

Amanda Shinoy is one of the few women in the space invested knee-deep in crypto. An advocate for increasing the presence of women in crypto, she is known for her accurate technical analysis and price prediction of cryptocurrencies. Readers are often waiting for her opinion about the next rally. She is a finance expert with an MBA in finance. Quitting a corporate job at a leading financial institution, she now engages herself full-time into financial education for the general public.


