
 Home
Home News
News
- 1 BEAM price showed a rebound from the 50 day EMA and trapped sellers.
- 2 Buyers have shown their presence and have retained the 20 day EMA mark.
BEAM price showed a volatile move and formed a long-legged rejection candlestick from the 50-day EMA mark. Moreover, the trend is neutral, and BEAM crypto has retested the immediate support zone of $0.012200 in yesterday’s trading session. BEAM crypto has halted the gains above the neutral trajectory.
BEAM price has retained the 20-day EMA mark and displayed a follow-on buying after a sharp pullback, exhibiting the buyers’ aggressiveness and willingness to surpass the supply zone of $0.22200. Per the technicals, BEAM crypto must stretch the buying action and continue to shine above the 20-day EMA mark.
At press time, BEAM crypto is trading at $0.02064 with an intraday gain of 13.22%, showing a pullback on the chart. Moreover, the trading volume surged by 9.80% to $99.87 Million. The pair of BEAM/BTC is noted at 0.000000477BTC, and the market cap is $989.38 Million. Analysts have maintained a neutral rating and suggest that the BEAM price may soon surpass the immediate hurdle of $0.021000 in the following sessions.
BEAM on Hourly Chart Displays Bullish Crossover

The BEAM price surpassed the cage on the hourly chart and exited the neckline above the key moving averages, delivering a range breakout in yesterday’s trading session. However, the bulls failed to extend the gains and are facing rejection near $0.22000.
The relative strength index (RSI) curve stayed in the overbought zone and showed a pullback on the chart. The MACD indicator showed a bullish crossover and formed green bars on the histogram, suggesting the continuance of buying momentum in the following sessions.
BEAM on Daily Chart Reflects Neutral Sentiments
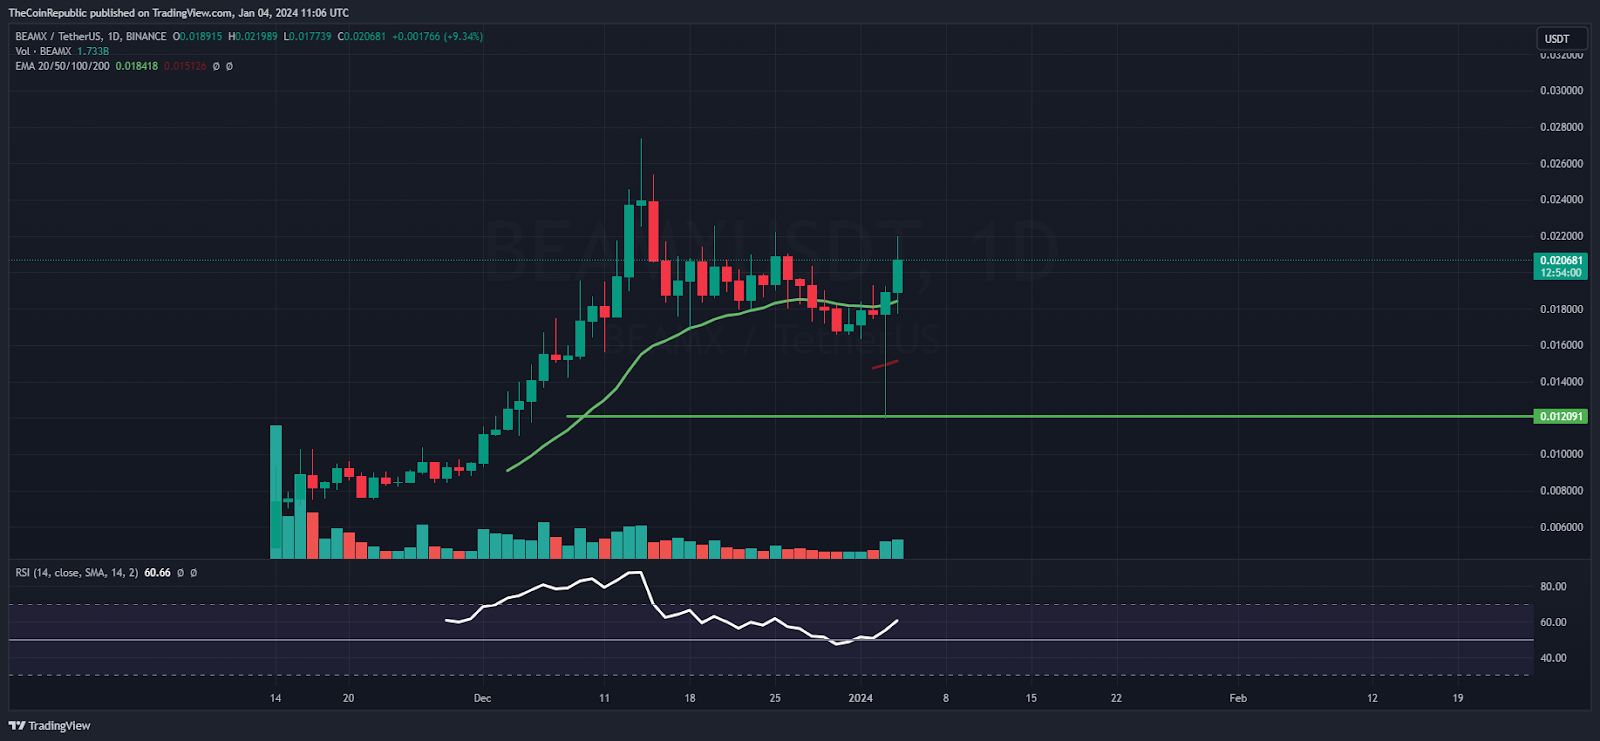
On the daily chart, BEAM price has exhibited a roller coaster move and displayed volatility. Recently, BEAM price retested the 50-day EMA mark near $0.012800 and sharply bounced back toward the round mark of $0.022000, which highlights the battle between the bulls and bears. Per the Fibonacci retracement levels, BEAM price has sustained the gains above the 38.2% level and sharply bounced from the 23.6% zone in yesterday’s session.
Summary
BEAM price pulled back from the 50-day EMA mark and retained the neutral trajectory in yesterday’s session. Moreover, the buyers are eager to surpass the immediate hurdle of $0.022000 and want to break the walls to reach the blue sky zone.
Technical Levels
Support Levels: $0.02000 and $0.01800
Resistance Levels: $0.02200 and $0.02380
Disclaimer
The views and opinions stated by the author or any other person named in this article are for informational purposes only and do not constitute financial, investment, or other advice. Investing in or trading crypto or stocks comes with a risk of financial loss.
Steve Anderson is an Australian crypto enthusiast. He is a specialist in management and trading for over 5 years. Steve has worked as a crypto trader, he loves learning about decentralisation, understanding the true potential of the blockchain.


