
 Home
Home News
News
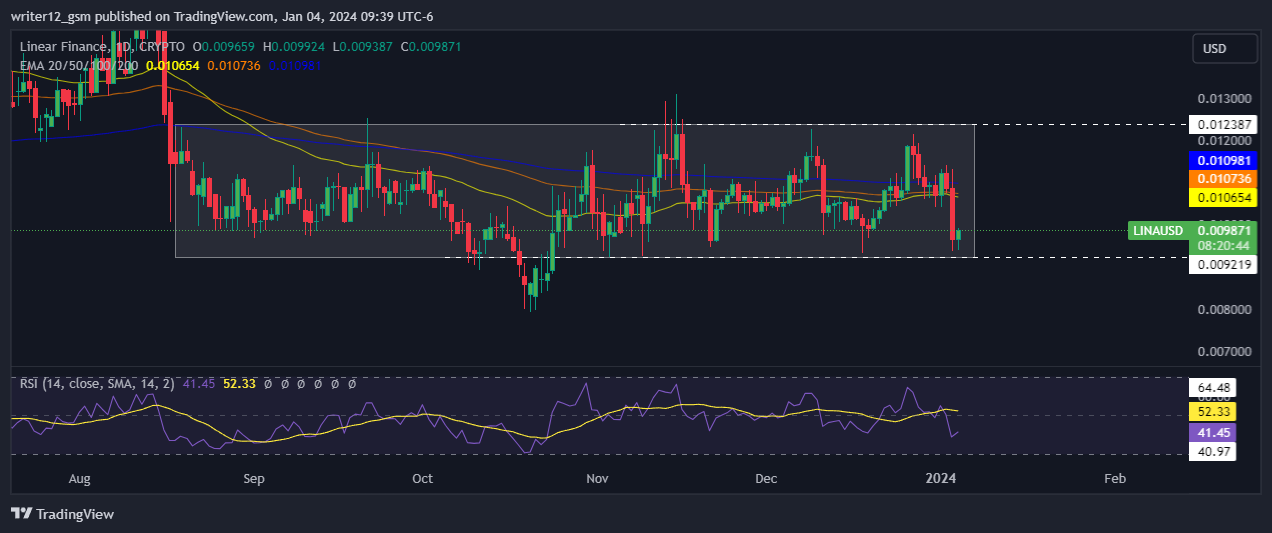
- 1 Linear Finance (LINA) is trading in a consolidation zone between the price range of $0.012387 and $0.009219.
- 2 The line is trading below the key moving averages, showcasing bearishness.
- 3 Technical indicators are highlighting the consolidation phase of Linear Finance crypto.
The Linear Finance price forecast suggests that bears and bulls are fighting to get a grasp on the trend. The green candle is rising steadily, indicating that the LINA price is attracting buyers in the demand zone. Investors may prefer to wait for multiple technical indicators to converge to determine trend direction.
Investor sentiment on the Linear Finance price is currently undecided and may remain negative unless buyers actively participate in price movements. However, given the technical indicators and price action, the odds are in favor of the bulls.
The price of the Linear Finance cryptocurrency will attract buyers towards the upper trend line of the consolidation phase on the daily chart. Meanwhile, the Linear Finance cryptocurrency price is trying to find support and rise toward the 20-day, 50-day, 100-day and 200-day moving averages.
The Linear Finance cryptocurrency is consolidating with a horizontal price range from $0.012387 to $0.009219. However, the price of Linear Finance cryptocurrency fell by about 15.41% in one week but rose by 6.12% in one month. Additionally, the price of the LINA cryptocurrency has fallen by 5.74% approx over the past three months and by approximately 24.28% over the past six months. However, the Linear Finance cryptocurrency chart shows a downtrend in the past few sessions. However, analysts believe that the price of the LINA cryptocurrency may rebound from low levels.
Linear Finance Crypto Price Has Been Consolidating Inside the Price Range
To breach the upper limit of the consolidation phase, the price of the Linear Finance cryptocurrency must rise sharply. However, for the Linear Finance cryptocurrency to enter the recovery phase, it needs more buyers. Meanwhile, the price of Linear Finance cryptocurrency fell below the 20-day, 50-day, 100-day, and 200-day moving averages. Additionally, the Linear Finance cryptocurrency should register a breakout during the consolidation phase on the daily chart.
MACD shows the consolidation phase of the price of Linear Finance cryptocurrency. The MACD line is placed above the signal line and waits for any type of crossover. Linear Finance cryptocurrency investors should wait for a change in direction on the daily chart.
Technical indicators indicate a consolidation phase in the price of the Linear Finance cryptocurrency. The relative strength index (RSI) shows the sideways momentum of the Linear Finance cryptocurrency. RSI was at 00 and moving towards oversold territory.
Summary
To accelerate toward the recovery phase, Linear Finance cryptocurrency needs more buyers. Technical indicators indicate a period of price consolidation for the LINA cryptocurrency. Linear Finance cryptocurrency investors should monitor directional changes on the daily charts.
Technical Levels
Support Level: $0.009219.
Resistance Levels: $0.012387
Disclaimer
The analysis provided in this article is for informational and educational purposes only. Do not rely on this information as financial, investment, or trading advice. Investing and trading in crypto involves risk. Please assess your situation and risk tolerance before making any investment decisions.

Nancy J. Allen is a crypto enthusiast, with a major in macroeconomics and minor in business statistics. She believes that cryptocurrencies inspire people to be their own banks, and step aside from traditional monetary exchange systems. She is also intrigued by blockchain technology and its functioning. She frequently researches, and posts content on the top altcoins, their theoretical working principles and technical price predictions.


