
 Home
Home News
News
- 1 SEI price jumped massively and enlisted a breakout in recent sessions.
- 2 SEI token price reached the cliff, depicting an uptrend on the chart.
SEI price rolled above the sellers’ eyesight and made a 52 week high of $0.8850 highlighting buyers’ dominance. Moreover, the trend is intact, and buyers have continued stretching the up move, reflecting outperformance for the past sessions. Furthermore, the price action delivers the higher high swings, and follow-on buying momentum was witnessed on the chart.
SEI token price has surpassed the key moving averages and is sustaining gains in the bullish trajectory, reflecting bullish sentiments on the chart. However, the SEI price has retraced to the 50-day EMA and is awaiting a pullback. Per the Fibonacci retracement zone, SEI token has escaped the 61.8% zone and is above the mid bollinger band.
At press time, the SEI token is trading at $0.7693 with an intraday gain of 7.32%, showing a breakout on the chart. Moreover, the trading volume jumped by 82.80% to $1.72 Billion, directing massive investor interest. The pair of SEI/BTC is noted at 0.0000185 BTC, and the market cap is $ 1.44 Billion. Analysts have maintained a bullish rating and suggest that the SEI price has reached the blue sky zone and will continue to gain.
SEI on Hourly Chart Displays Higher High Swings
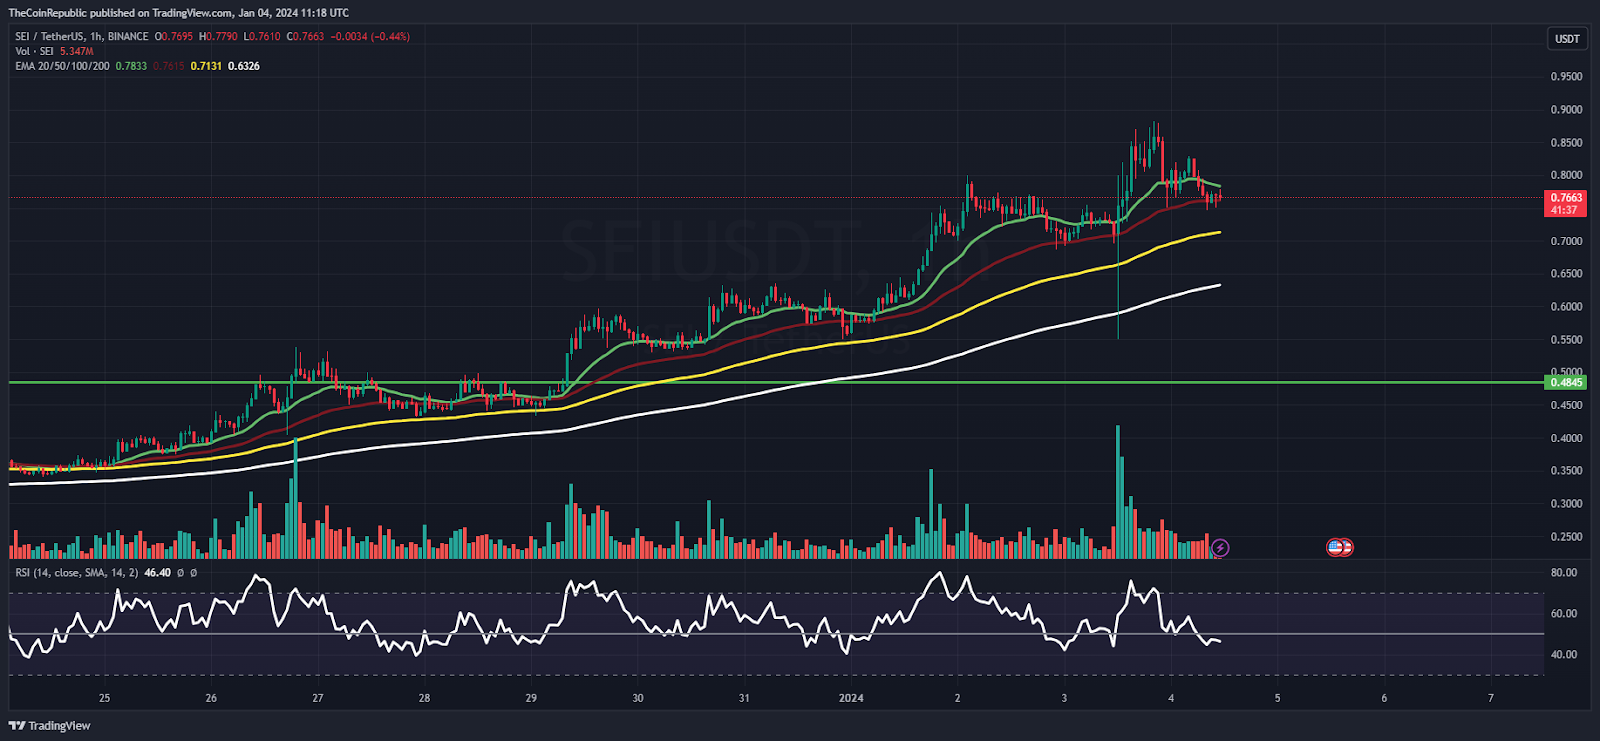
On the hourly chart, SEI token displayed a sharp exit and persisted in displaying the bull rally beyond the sellers’ vision. Additionally, the SEI token has rewarded the investors and hit a fresh 52-week high in recent sessions. Moreover, the trend is intact and further short covering rally may continue.
SEI on Daily Chart Reflects Breakout
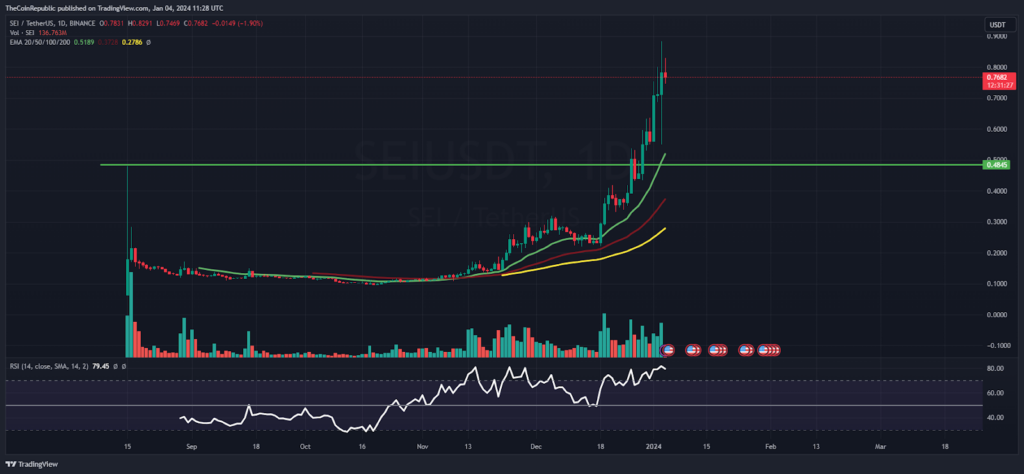
On the daily chart, the SEI token rolled over 130% from the immediate support zone of $0.4000 near the 20-day EMA mark and has sharply risen toward the blue sky zone. Moreover, the token has witnessed investor demand and displayed a massive volume spike, reflecting the accumulation in recent sessions.
The RSI curve stayed in the overbought zone, reflecting a positive crossover, indicating the bulls’ dominance on the chart. Moreover, the MACD indicator showed a bullish crossover and formed green bars on the histogram, suggesting that the SEI token will continue to rally in the following sessions.
Summary
SEI token displayed a massive pump and hit a fresh 52-week high mark, reflecting bullish momentum in recent sessions. Moreover, the price action highlights the bulls’ dominance. SEI token may continue to gain and reach $1.000.
Technical Levels
Support Levels: $0.7600 and $0.7400
Resistance Levels: $0.7800 and $0.8000
Disclaimer
The views and opinions stated by the author or any other person named in this article are for informational purposes only and do not constitute financial, investment, or other advice. Investing in or trading crypto or stocks comes with a risk of financial loss.

Adarsh Singh is a true connoisseur of Defi and Blockchain technologies, who left his job at a “Big 4” multinational finance firm to pursue crypto and NFT trading full-time. He has a strong background in finance, with MBA from a prestigious B-school. He delves deep into these innovative fields, unraveling their intricacies. Uncovering hidden gems, be it coins, tokens or NFTs, is his expertise. NFTs drive deep interest for him, and his creative analysis of NFTs opens up engaging narratives. He strives to bring decentralized digital assets accessible to the masses.


