
 Home
Home News
News
- 1 APT price formed the double top pattern and faced rejection in recent sessions.
- 2 APT price displays an inverted hammer candlestick replicating sellers’ grip at $11.
APT price displayed a channel breakout and retested the neckline of $11 in recent sessions. However, the buyers failed in their mission and faced rejection, resulting in a retracement, and the APT price slipped toward $10. Overall, the chart reflected indecisiveness, however, buyers persisted in stretching the rally inside the channel and lifted the APT price beyond $10.
APT price has reentered the channel and has taken support on the 20-day EMA mark, displaying an uptrend on the chart. Moreover, the trend is intact, and buyers will soon lead a sharp jump and crash the immediate hurdle of $11 in the following sessions. The price action displays a higher high formation, and that APT price is trading above the neutral trajectory, exhibiting buying momentum in recent sessions.
At press time, APTOS (APT) crypto was trading at $10.73 with an intraday gain of 12.32%, showing a bullish structure. Moreover, the trading volume jumped by 22.80% to $792.07 Million, delivering investor interest. The pair of APT/BTC was at 0.000238 BTC, with a market cap of $1.37 Billion. Analysts have maintained a bullish rating and suggest that the APT price will continue to spread gains in the following sessions.
APT on Daily Chart Displays a Rising Parallel Channel
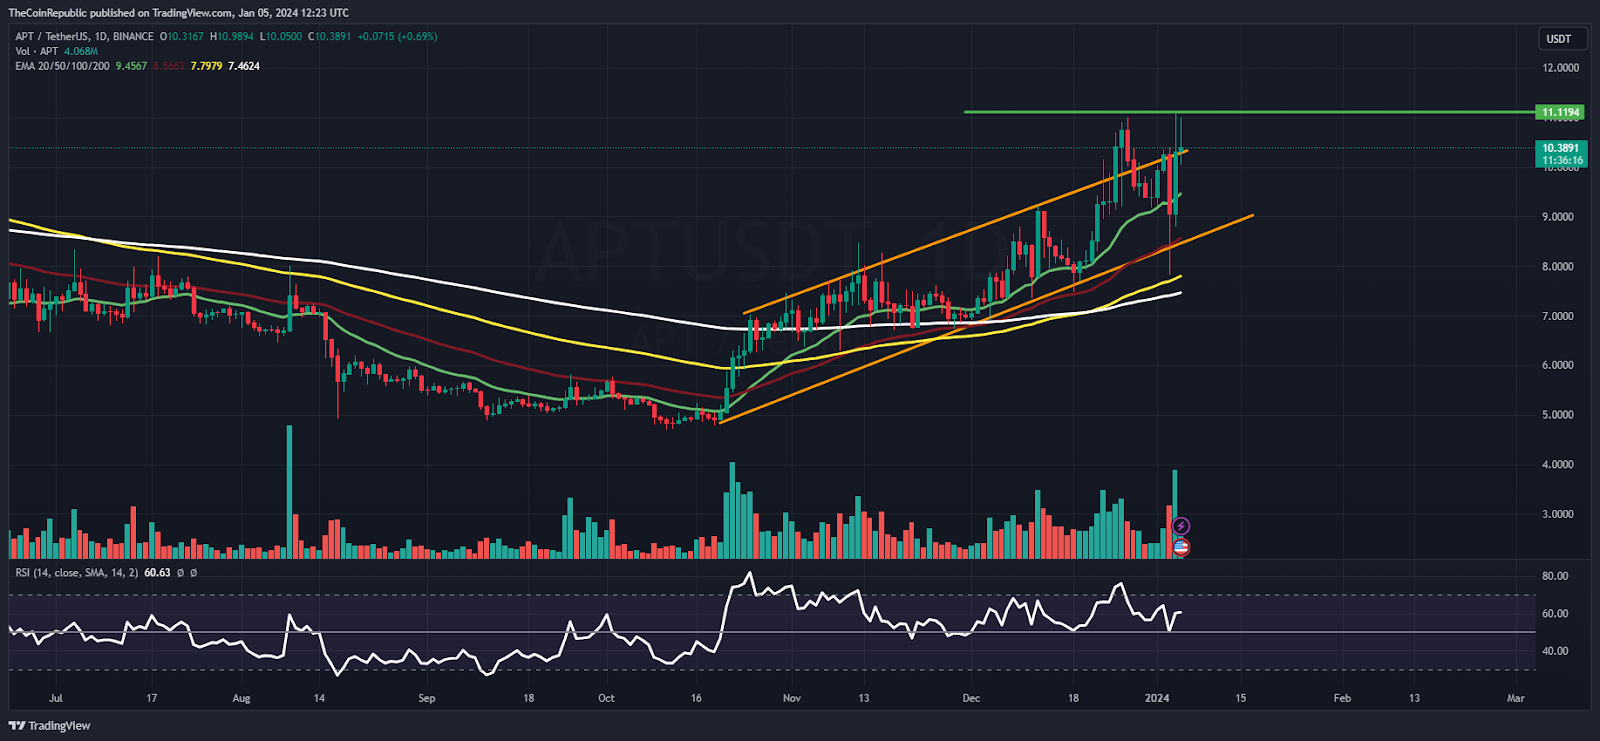
On the daily chart, the APT price led to a reversal and rebounded from the bottom zone of $5, surging by 100% in recent weeks. Moreover, the buyers have persisted in extending the rally followed by the crypto market pump. The trend favors the bulls and exhibits a bullish bias. Any correction near $10 is a buying opportunity, and a higher trajectory to $12 can be anticipated in the following sessions.
The relative strength index (RSI) curve stayed in the overbought zone near 65, showing a positive crossover, suggesting an optimistic outlook for the upcoming sessions. The MACD indicator showed a bullish crossover and formed green bars on the histogram, offering that the bull rally would continue in the following sessions.
Weekly Charts Reflects Bullish Crossover
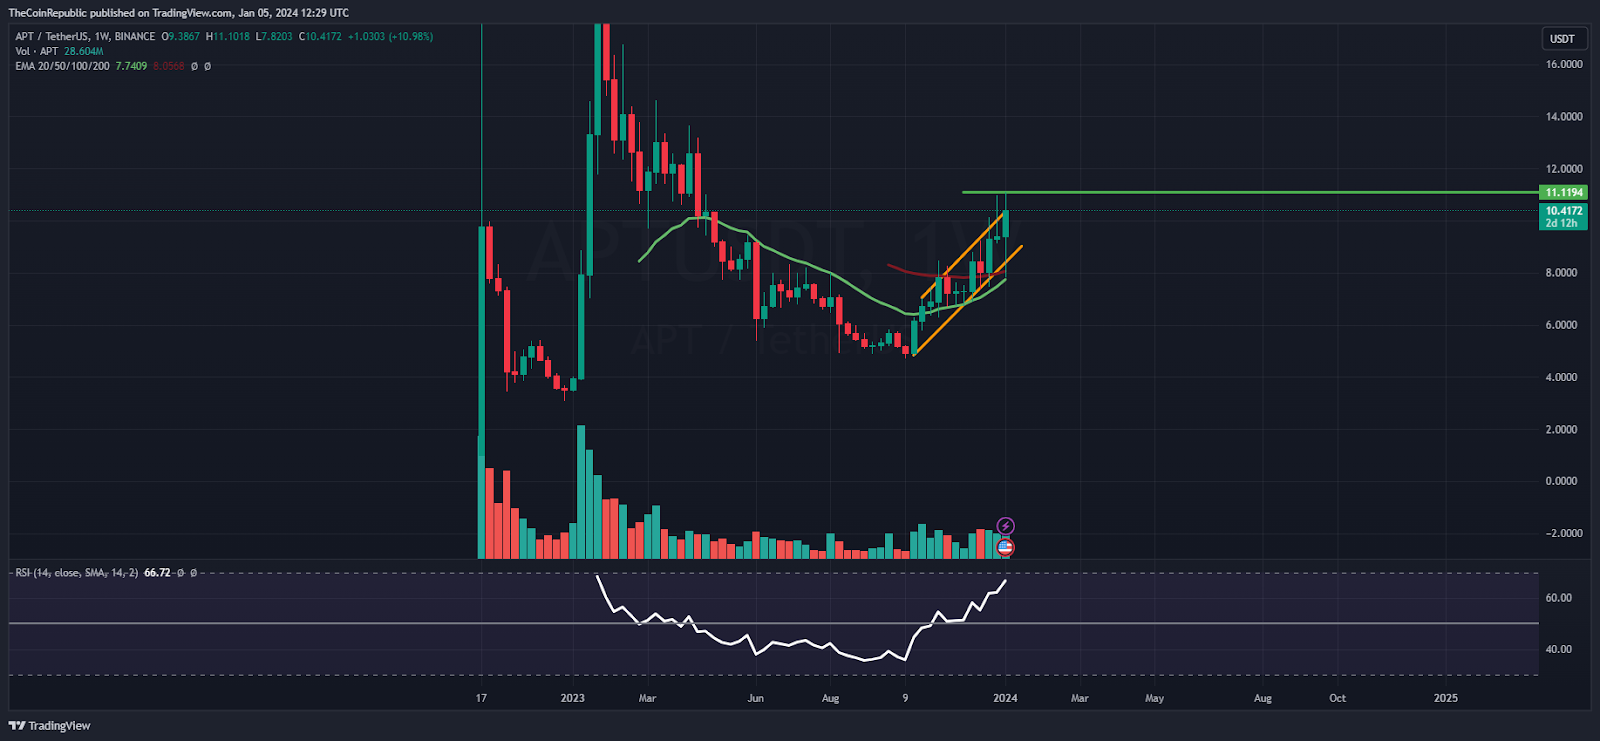
On the weekly chart, APT price reflected a bullish crossover and rolled above $10, depicting buying momentum in recent sessions. Moreover, the price action exhibits long buildup activity, where sellers covered their short positions and looked trapped. The APT price has also surpassed the key moving averages and is sustaining above the 50% Fib zone.
Summary
APT price reflects an uptrend and is ready to enter the blue sky zone above $11 soon but failed to break out. Amid the crypto pump, buyers are trying their best to surpass $11, but a rejection candlestick was spotted, highlighting a strong seller grip.
Technical Levels
Support Levels: $10 and $9.50
Resistance Levels: $11 and $11.60
Disclaimer
The views and opinions stated by the author or any other person named in this article are for informational purposes only and do not constitute financial, investment, or other advice. Investing in or trading crypto or stocks comes with a risk of financial loss.

Andrew is a blockchain developer who developed his interest in cryptocurrencies while pursuing his post-graduation major in blockchain development. He is a keen observer of details and shares his passion for writing, along with coding. His backend knowledge about blockchain helps him give a unique perspective to his writing skills, and a reliable craft at explaining the concepts such as blockchain programming, languages and token minting. He also frequently shares technical details and performance indicators of ICOs and IDOs.


