
 Home
Home News
News
- 1 Kaspa (KAS) crypto price is currently trading at $0.106240 with a drop of 4.12% in the last 24 hours with a current market cap of $0.0142 Million.
- 2 Kaspa’s crypto price decreased by 10.22% over the past seven days.
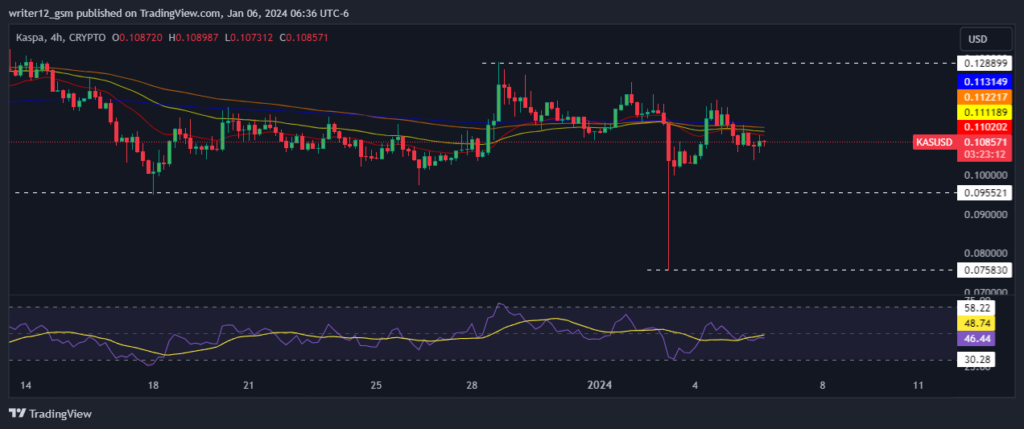
Kaspa price has been declining from its peak levels and forming lower-low structures. It is in a bearish trend after breaking below the 20-day and 50-day exponential moving averages. The bearish pressure might push KAS to form a new lower low soon and extend the downtrend.
Kaspa price (KAS) failed to sustain the high of $0.154345 and reversed its direction, indicating further weakness in the market. The KAS is trading below the dynamic support trendline, which could lead to more downside. The market is also in a downtrend on a shorter time frame, as it is creating lower lows.

The current situation requires traders and investors to be patient and wait for a clear signal of a break above or below the range before making any moves. They should also avoid FOMO and minimize losses.
Kaspa crypto price fell 10.22% last week. It declined by 21.45% through the month. Furthermore, KAS cryptos experienced a rise of roughly 325.92% within the past six months and an increase of 2262.20% over the past year.
Additionally, the KAS crypto price has slipped by approximately 3.88% year to date. These trends collectively highlight the Kaspa crypto’s volatility throughout the year.
Technical Analysis of Kaspa Crypto Price in 1-D Time Frame
At the moment, Kaspa crypto (USD: KAS) is trading below the 50 and 200-day exponential moving averages (EMAs), which are not supporting the price trend. If bulls want to make a comeback, they will have to rise and sustain the price above the 20-day EMA. However, the sellers seem to be more aggressive as compared to buyers.
The current value of RSI is 45.96 points. The 14 SMA is above the median line at 47.29 points which indicates that the Kaspa crypto is bearish. The MACD line at -0.001628 and the signal line at -0.001665 are below the zero line. A bearish crossover was observed in the MACD chart which signals more bearishness for the KAS crypto price.
Summary
Kaspa crypto price chart reflects strong bearishness. The sellers are dominating on the higher levels. Kaspa (USD: KAS) technical oscillators also support the bearish trend. The MACD, RSI, and EMAs are emphasizing negative signs and imply that the downtrend may continue in the KAS crypto price. Kaspa price action suggests that the investors and traders are bearish on the 1-D time frame. The technical analysis suggests that the Kaspa crypto price is in a bearish grip and the probability of testing the previous highs in the coming months remains low.
Technical Levels
Support Level: $0.095987
Resistance Levels: $0.128899
Disclaimer
This article is for informational purposes only and does not provide any financial, investment, or other advice. The author or any people mentioned in this article are not responsible for any financial loss that may occur from investing in or trading. Please do your own research before making any financial decisions

Andrew is a blockchain developer who developed his interest in cryptocurrencies while pursuing his post-graduation major in blockchain development. He is a keen observer of details and shares his passion for writing, along with coding. His backend knowledge about blockchain helps him give a unique perspective to his writing skills, and a reliable craft at explaining the concepts such as blockchain programming, languages and token minting. He also frequently shares technical details and performance indicators of ICOs and IDOs.


