
 Home
Home News
News
- 1 XRP price was dragged towards the 200-Day EMA under selling pressure.
- 2 Buyers did not manage to protect the gains and exhibited slippages.
XRP price broke down and is starving near the 200-day EMA, revealing selling pressure on the charts. After consolidation near the 20-day EMA and reflecting the lower lows pattern, a rejection candlestick at the top resulted in a breakdown, and a sharp, bearish candlestick was spotted in recent sessions. However, buyers took their last attempt, made a small doji candlestick at the 200-day EMA, and attempted a pull back.

XRP price is hovering near the 200-day EMA, which is a make-or-break zone. However, the trend replicates the short buildup and profit booking in the past few sessions. Along with the selling pressure, a lower low swing was witnessed in the past few sessions. However, a rejection wick was spotted at $0.500, a vital support area.

At press time, the XRP coin was trading at $0. 5665 with an intraday drop of 1.42%, showing a bearish structure. Moreover, the trading volume jumped by 5.80% to $1.35 Billion, indicating selling pressure. The pair of XRP/BTC was noted at 0.0000129 BTC, while the market cap is $30.84 Billion. Analysts have maintained a neutral rating and suggest that the XRP price will soon retest its crucial support zone of $0.300.
XRP on Daily Chart Reflects Breakdown
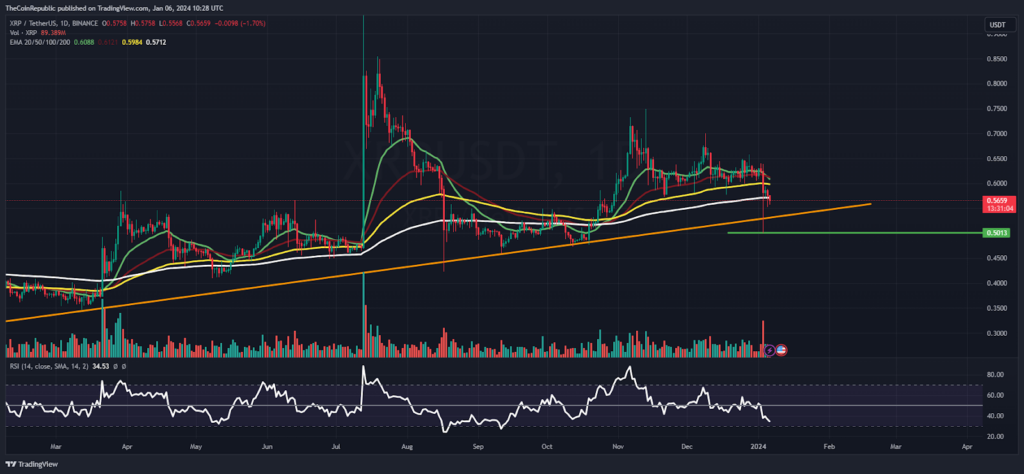
On the daily chart, XRP price has lost its initial gains and lagged momentum in the past few sessions. Amid the positive sentiments and the crypto pump, XRP did not enjoy the craze and continued to reflect selling pressure, which is redirecting that XRP price will retest the lows of $0.300 in the upcoming sessions.
The relative strength index (RSI) curve stayed below the midline close to 35, showing a negative crossover indicating seller dominance. The MACD indicator showed a bearish crossover, and reflected red bars on the histogram, suggesting that underperformance may continue in the following sessions.
Will Bears Succeed In Dragging XRP Below 200 Day EMA?
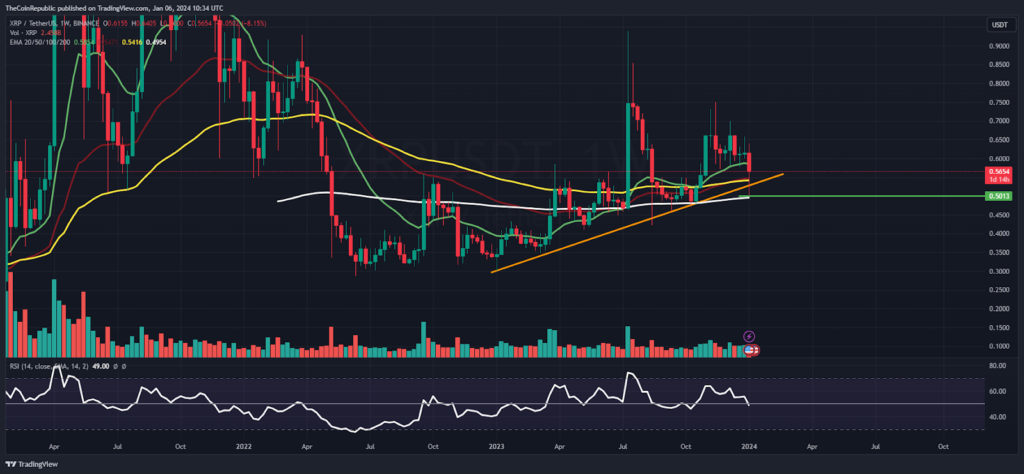
On the weekly chart, XRP coin price has finally switched to the lower trendline and is struggling to rescue the gains near the 200-Day EMA. Despite the market reversal, XRP price did not succeed in swapping the leadership, and the bear cartel persisted in forcing the bulls to unwind their long positions, resulting in a decline.
Summary
XRP price is at its make-or-break zone near the 200-day EMA and is trying to protect the region, which can not lead to any massive fall. Moreover, the price action is favoring the bears and indicates strong selling pressure, leading to a fall from the top in recent sessions.
Technical Levels
Support Levels: $0.500 and $0.420
Resistance Levels: $0.630 and $0.700
Disclaimer
The views and opinions stated by the author or any other person named in this article are for informational purposes only and do not constitute financial, investment, or other advice. Investing in or trading crypto or stocks comes with a risk of financial loss.

Adarsh Singh is a true connoisseur of Defi and Blockchain technologies, who left his job at a “Big 4” multinational finance firm to pursue crypto and NFT trading full-time. He has a strong background in finance, with MBA from a prestigious B-school. He delves deep into these innovative fields, unraveling their intricacies. Uncovering hidden gems, be it coins, tokens or NFTs, is his expertise. NFTs drive deep interest for him, and his creative analysis of NFTs opens up engaging narratives. He strives to bring decentralized digital assets accessible to the masses.


