
 Home
Home News
News

- 1 BAT price showcased range-bound moves and stuck in a narrow range.
- 2 The Basic Attention Token slipped from the 50-day EMA support zone, displaying selling pressure.
Basic Attention Token (BAT) is an ERC-20 token built on top of Ethereum. This utility token aims to improve the digital advertising industry. It did not manage to surpass the supply zone of $0.2700 and faced rejection, which led to a sharp retracement. Amid the market rebound, the price rebounded only by 35%, showcasing low investor interest for the past sessions.
The BAT price is trading above the 200-day EMA and is showcasing neutrality on the charts. Recently, a reversal was witnessed, the price recovered from the bottom mark of $0.1500, and reached the cliff of $0.2700. The journey and the buying momentum finally ended, and sellers are now engaged in short buildups and are trying to throw the BAT price below the 200-day EMA.

At press time, Basic Attention Token (BAT) is trading at $0.2352 with an intraday gain of 4.60%, showing neutrality on the chart. Moreover, the trading volume increased by 12.20% to $46.70 Million, highlighting sellers’ interest. The pair of BAT/BTC was noted at 0.00000503 BTC, while the market cap is $349.26 Million. Analysts are neutral and suggest that the BAT price will shrink more and may retest the lows of $0.2000 again.
BAT On Daily Charts Signals Sellers Dominance
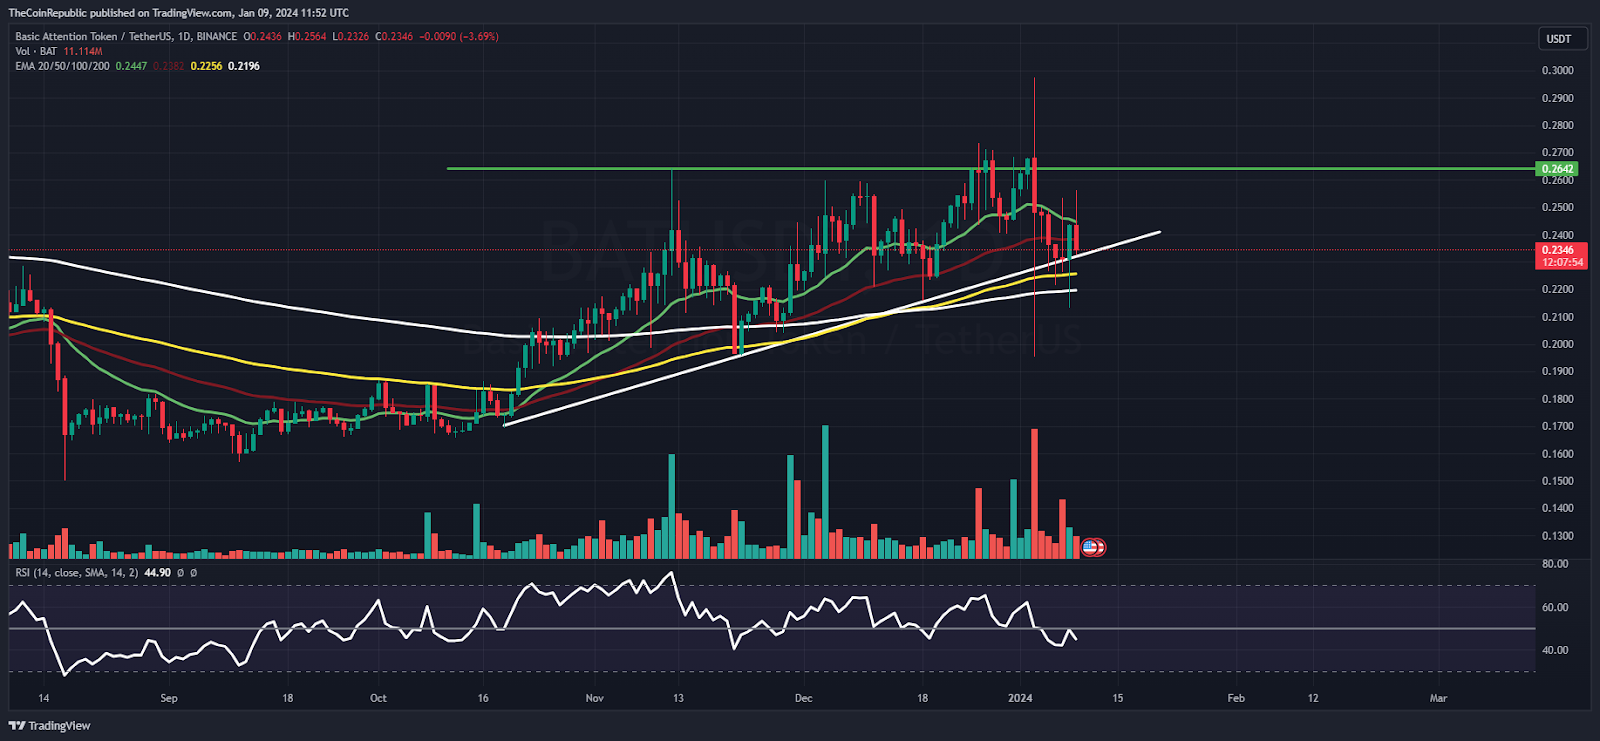
On the daily charts, the BAT price displayed a rejection and flipped from the supply zone of $0.2700 in the recent sessions. Moreover, the price action shows the selling pressure. A rejection candlestick from the 200-day EMA helps bulls to halt gains near $0.2300.
The relative strength index (RSI) slipped below the midline and is heading to the oversold region, displaying a negative crossover. The MACD indicator showed a bearish crossover and formed red bars on the histogram, suggesting that the BAT price will reflect underperformance in the following sessions.
Weekly Charts Displays Rejection From 50-Day EMA
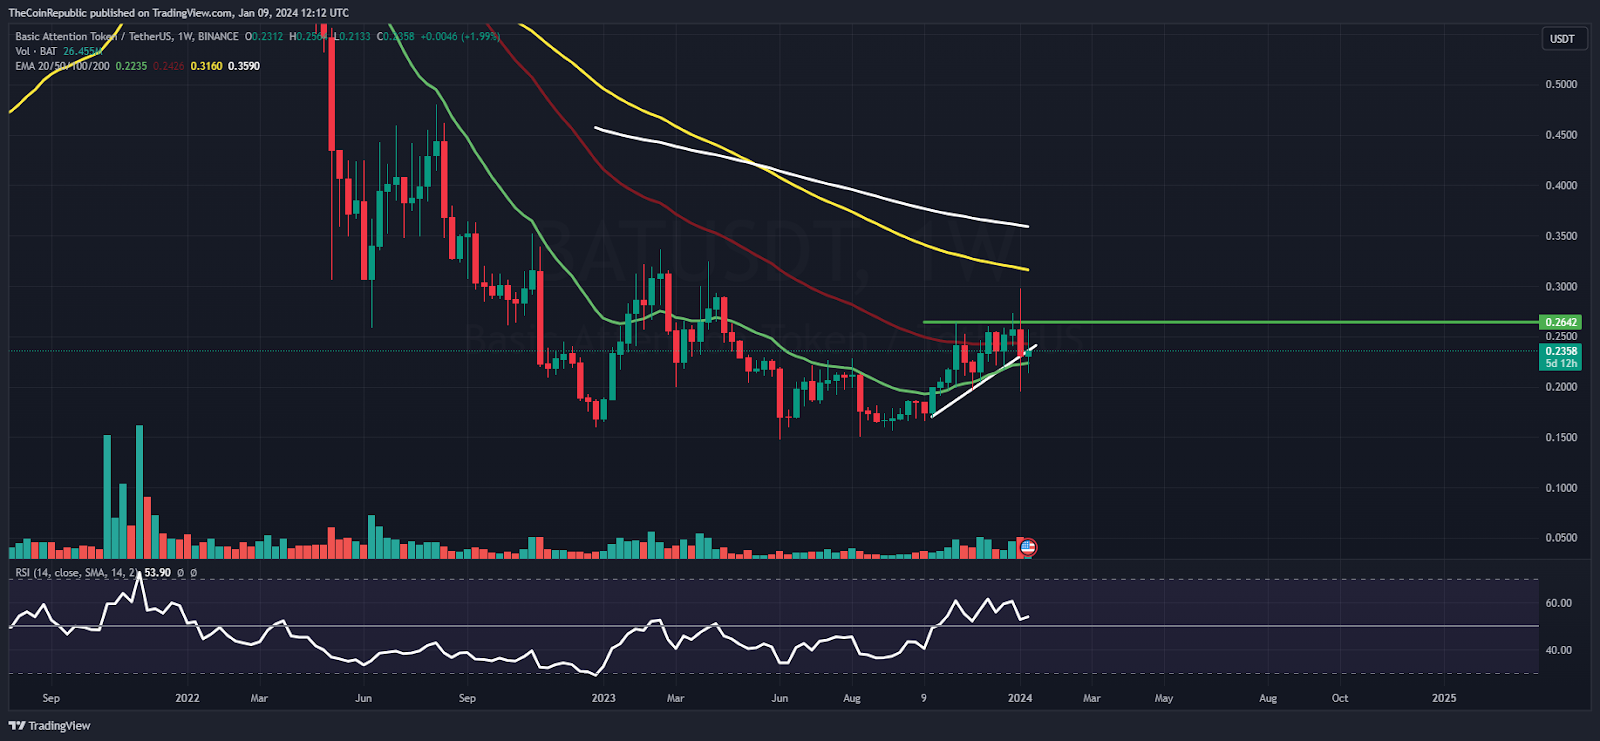
On the weekly charts, the BAT price displayed a rejection from the 50-day EMA mark. It showed a bearish engulfing candlestick and sellers started making fresh short positions. Furthermore, the technical indicators are signaling a down move and a sell-off may happen in the short term.
Summary
The BAT price showcased a reversal from the top and witnessed rejection from the supply zone of $0.2700 in the recent sessions. Moreover, the price action showcased the sellers’ dominance and the bear cartel looked aggressive. Additionally, the 200-day EMA is the make-or-break mark that investors are eyeing to protect in the following sessions.
Technical Levels
Support Levels: $0.2000 and $0.1800
Resistance Levels: $0.2500 and $0.2700
Disclaimer
The views and opinions stated by the author or any other person named in this article are for informational purposes only and do not constitute financial, investment, or other advice. Investing in or trading crypto or stocks comes with a risk of financial loss.

Steefan George is a crypto and blockchain enthusiast, with a remarkable grasp on market and technology. Having a graduate degree in computer science and an MBA in BFSI, he is an excellent technology writer at The Coin Republic. He is passionate about getting a billion of the human population onto Web3. His principle is to write like “explaining to a 6-year old”, so that a layman can learn the potential of, and get benefitted from this revolutionary technology.


