
 Home
Home News
News
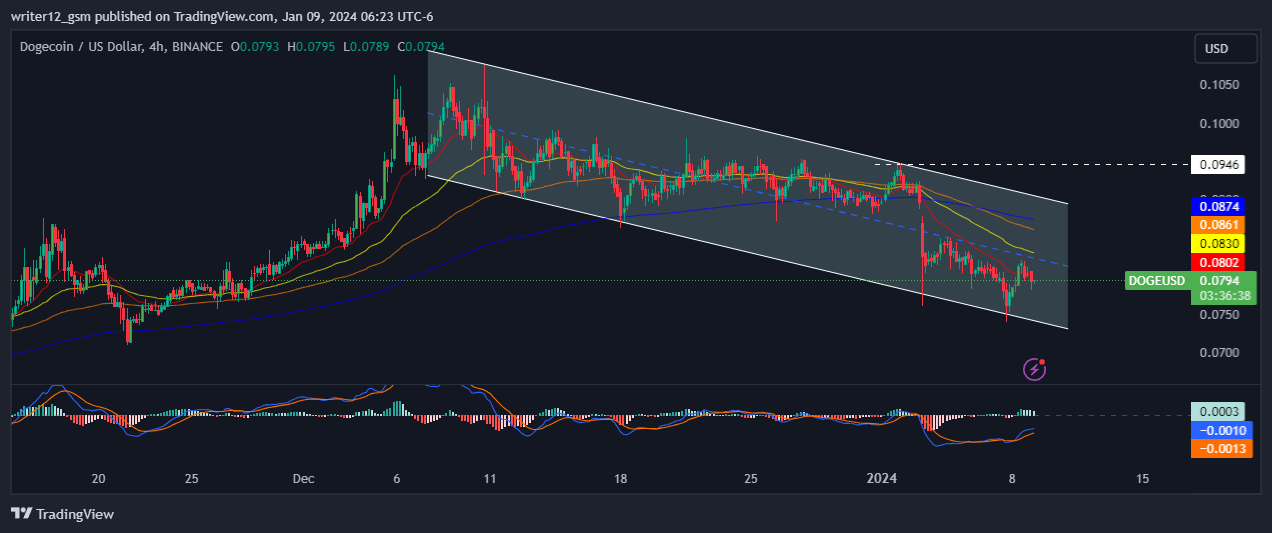
- 1 Dogecoin breaks below the key moving averages of 20,50 and 100, showcasing bearishness.
- 2 DOGE price is taking support on the 200-Day Ema.
The Dogecoin price (USD: DOGE) is trading within a downward channel and making lower lows and lower highs. The crypto has attempted to reverse the current trend and break the critical level of $0.0946 below the 200-day EMA, but it failed. That shows the sellers are dominant and unwilling to give up on the trend.
At the time of writing, DOGE crypto was trading at $0.0789 with a loss of 3.43% for the day. It broke below the 200-day EMA, which indicates bearishness on the charts. The trading volume is 475.006 Million, showing a lack of interest from the buyers. The market cap of DOGE crypto is 11.321 Billion.
However, DOGE crypto has stayed in a downtrend over the past months and persisted in forming lower highs and lower lows sequences, facing rejection from the upper trendline, which acted as a hurdle to exiting the trend. Moreover, the price action shows that Dogecoin crypto has persisted in facing selling pressure, and buyers have stayed on the back foot. In contrast, sellers have a strong edge and continue to make short positions.
What Do Technical Indicators Hint About the Dogecoin Crypto?
On the daily charts, Dogecoin crypto showed a falling channel pattern. The price is near the lower trendline below the 50-day EMA, showing weakness on the charts. Recently, the crypto bounced back from the channel lows and headed towards upper trendlines but got rejected.
Dogecoin price is trading below the key moving averages, showcasing bearishness on the chart. However, the price is currently taking support on the 200 EMA, maintaining the possibility of a bounceback.
Weekly-Time Horizon Analysis of Dogecoin Price
Dogecoin crypto has shown sellers’ strength on the weekly time frame chart. Moreover, the price traded below the key EMAs, which indicates further weak points in the crypto.
However, the price-taking support on the 100 and 200 EMAs, shows support from buyers. Now faith in the price depends on whether it goes down or up from the current levels.
Summary
Dogecoin (USD: DOGE) technical oscillators support the bearish trend. The MACD, RSI, and EMA highlight negative signs and indicate that the downtrend may resume in the DOGE crypto price. Dogecoin Price action indicates that the investors and traders are bearish on the 1-D time frame.
The price action mirrors a bullish outlook at the moment. Moreover, Dogecoin Investors avoid the fear of missing out. Scarcity is constructed in the crypto market to acquire more additional investors and creditors. It is more profitable to keep it at arm’s length as this may result in one of the developing reasons for market volatility.
Technical Levels
Support Levels: $0.0569.
Resistance Levels: $0.1063.
Disclaimer
This article is for informational purposes only and does not provide any financial, investment, or other advice. The author or any people mentioned in this article are not responsible for any financial loss that may occur from investing in or trading. Please do your own research before making any financial decisions.

Andrew is a blockchain developer who developed his interest in cryptocurrencies while pursuing his post-graduation major in blockchain development. He is a keen observer of details and shares his passion for writing, along with coding. His backend knowledge about blockchain helps him give a unique perspective to his writing skills, and a reliable craft at explaining the concepts such as blockchain programming, languages and token minting. He also frequently shares technical details and performance indicators of ICOs and IDOs.


