
 Home
Home News
News

- 1 GT price slips below the 20-day EMA mark and is guiding profit booking.
- 2 Buyers have lost initial gains and are in trouble now.
GateToken is the native token of the cryptocurrency exchange Gate.io. It became the exchange token of Gate.io officially on March 2, 2020. This cryptocurrency can be used in VIP tier escalation, trading fee debit, exclusive activities participation, and more. GT price action shows the selloff and is guiding a retracement from the top of $5.70, eroding over 10% gains this week. Moreover, the chart showcased a descending triangle pattern. This token’s price is hovering near the lower neckline of $5.00, which is the make-or-break zone.
GateToken price is trading below the 20-day EMA and above the 50,100, and the 200-day EMA mark, depicting a favorable positive trend. Besides the retracement, the GT price has recovered over 34% in the past weeks. The technicals indicate higher high setups and a vertical rebound from the lows of $3.20 was witnessed on the charts.

At press time, GateToken(GT) is trading at $5.03 with an intraday gain of 1.89%, showing an uptrend on the chart. Moreover, the trading volume remained neutral and increased by 1.20% to $1.23 Million, highlighting profit booking. The pair of GT/BTC was noted at 0.000108 BTC, while the market cap is $683.74 Million. Analysts are neutral and suggest that the GT price will face volatility in the upcoming sessions.
GT On Daily Charts Displays Descending triangle Pattern
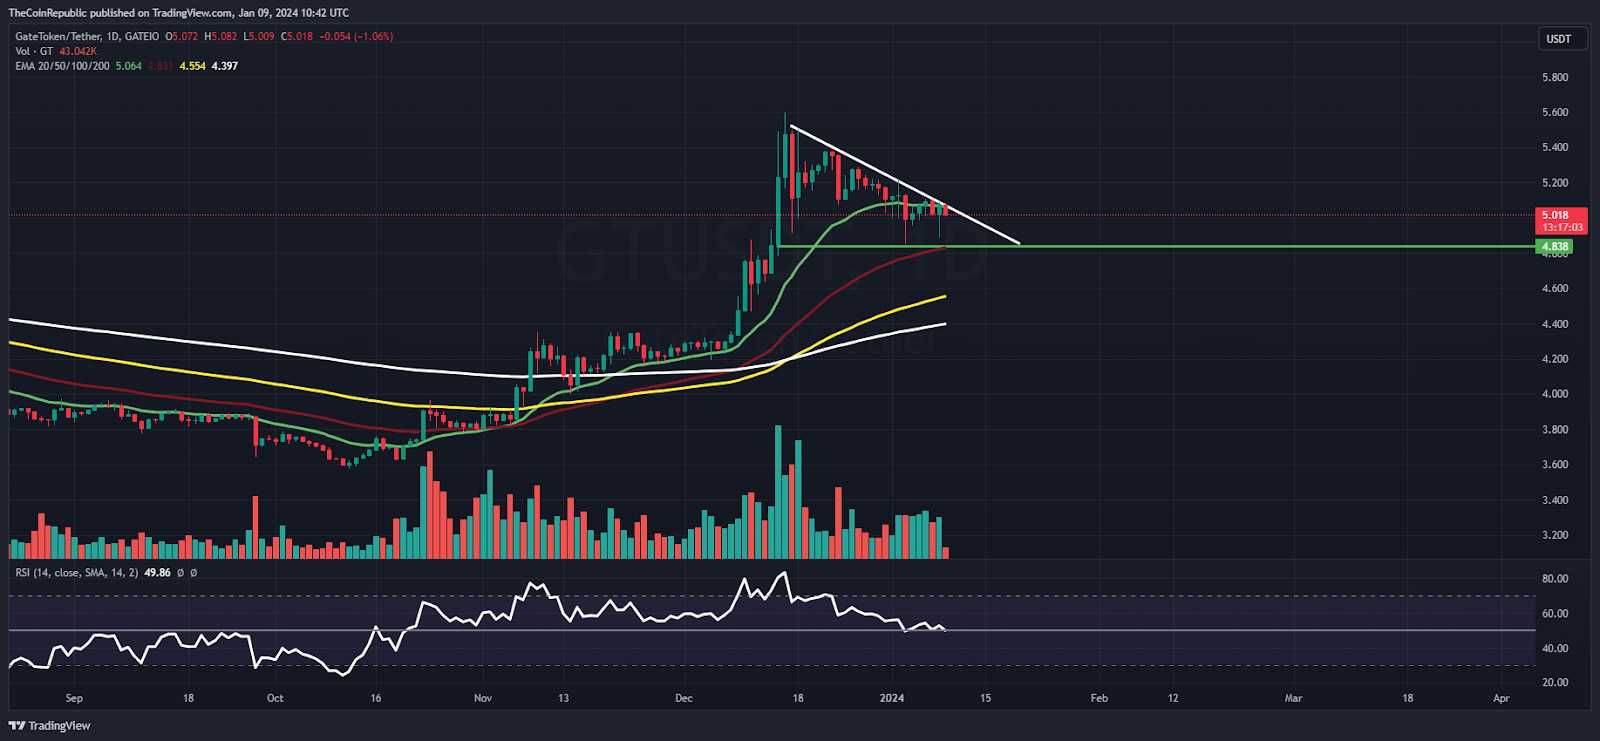
On the daily charts, GT price failed to stretch the gains and is redirecting gains to the round mark of $5, indicating sellers’ interest in the recent sessions. Recently, GateToken reached $5.60 and made a bearish engulfing candlestick. Afterward, lower low swings led the GT price toward the support zone of 20-day EMA.
The relative strength index (RSI) curve stayed at the midline near 50, showcasing a positive divergence. The MACD indicator showed a bearish crossover and formed red bars on the histogram, suggesting the volatile outlook for the upcoming sessions.
Per the Fibonacci retracement levels, GT price has retraced from 70 to 50 and slipped below the mid-bollinger band.
Weekly Charts Exhibits Rejection From Supply Zone
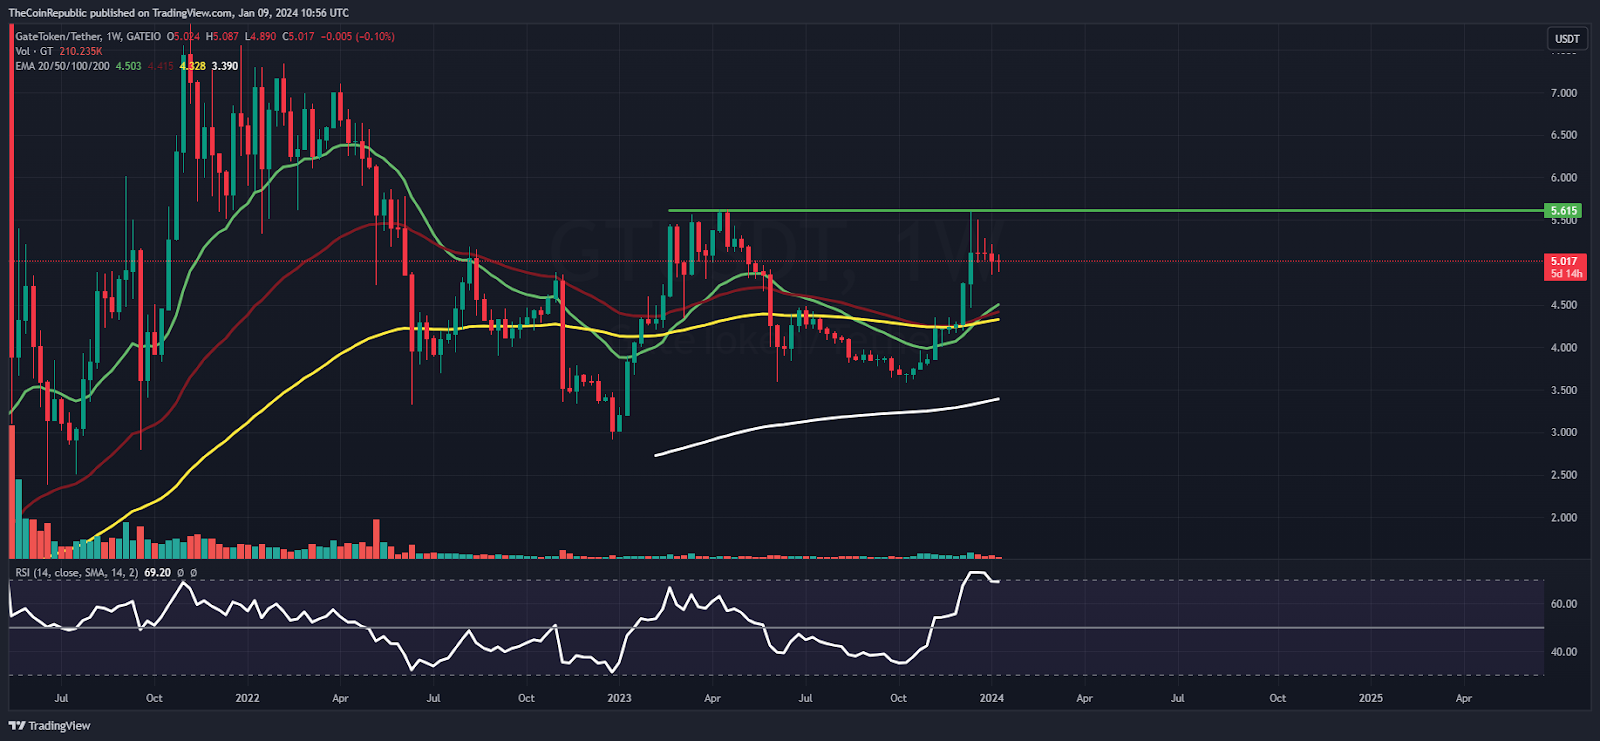
On the weekly charts, GT price rebounded from the bottom mark of $3.60 and retested the neckline of $5.60. Afterward, the price stuck over there and was in a dilemma; doji candlesticks were consecutively formed, and indecisiveness was witnessed.
Summary
GateToken (GT) price has reversed from the supply zone of $5.70 and replicated rejection in the recent sessions. Moreover, the sellers look aggressive and force bulls toward their home near the round mark of $5. The GT price is now hovering near the lower neckline of $5, which is the make-or-break swing mark that investors will be eyeing for the following sessions.
Technical Levels
Support Levels: $4.90 and $4.30
Resistance Levels: $5.20 and $5.70
Disclaimer
The views and opinions stated by the author or any other person named in this article are for informational purposes only and do not constitute financial, investment, or other advice. Investing in or trading crypto or stocks comes with a risk of financial loss.

With a background in journalism, Ritika Sharma has worked with many reputed media firms focusing on general news such as politics and crime. She joined The Coin Republic as a reporter for crypto, and found a great passion for cryptocurrency, Web3, NFTs and other digital assets. She spends a lot of time researching and delving deeper into these concepts around the clock, and is a strong advocate for women in STEM.


