
 Home
Home News
News

- 1 ROSE price showed a rejection from the high of $0.15000.
- 2 Buyers have poised gains near the 20-day EMA support zone.
ROSE price displayed a halt near the 20-day EMA support zone and is waiting for a pullback to surpass the upside hurdle of $0.15000. Moreover, the price action reveals the pullback from the 50-day EMA, and buyers are trying for a rebound amid the market uncertainty. However, a temporary top was noted, and a profit booking led the ROSE price toward $0.11000.
ROSE price is trading above neutrality and is hanging near the 20-day EMA, showcasing a double-top formation. Afterward, the technicals reflect a short-term retracement signal, and sellers are engaging in forcing the bulls. Per the trend, the ROSE price stays at a make-or-break zone, where sellers attempt to force below the 20-day EMA to stretch the down move. On the contrary, buyers are looking for a rebound to retest the swing barrier of $0.14000.

At press time, Oasis Network (ROSE) trades at $0.1195 with an intraday gain of 6.95%, showing neutrality on the chart. Moreover, the trading volume jumped by 5.20% to $55.95 Million, highlighting low buyer interest. The pair of ROSE/BTC was noted at 0.00000257 BTC, while the market cap is $179.11 Million. Analysts are neutral and suggest that the ROSE price will face volatility in the upcoming sessions.
ROSE On Daily Charts Reflects Retracement
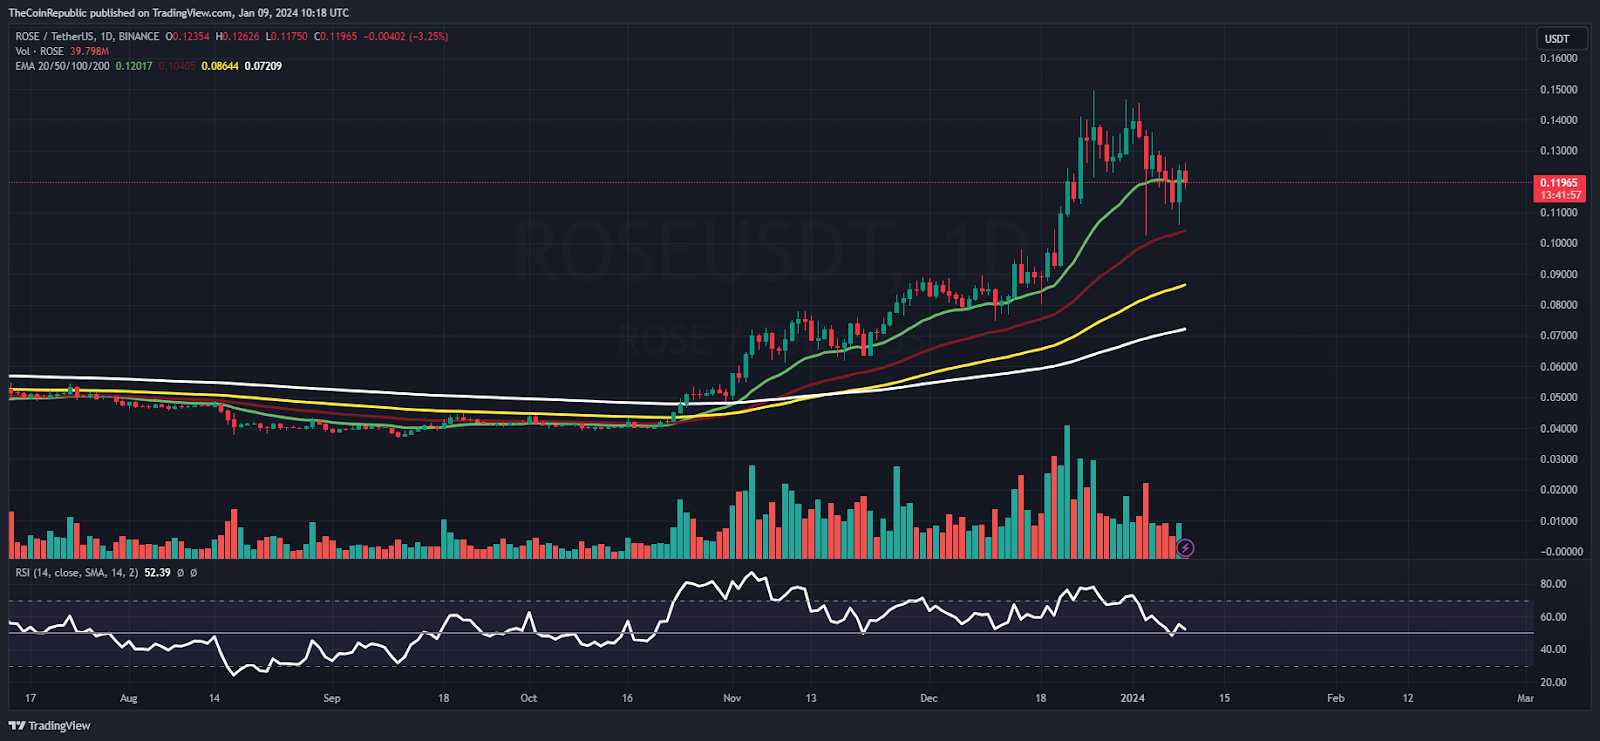
On the daily charts, the ROSE price shows higher high swings and surged over 80% in the recent sessions. Moreover, the buyers have guided strength and persist in stretching the up move amid the market indecisiveness. If the ROSE price sustains above $0.11000, it will be a positive sign for the short-term investors to make fresh long positions. Suppose it drags below, it will lead to a correction.
The relative strength index (RSI) curve stayed at the midline near 50, showcasing a positive divergence. The MACD indicator showed a bearish crossover and formed red bars on the histogram, suggesting the volatile outlook for the upcoming sessions.
Weekly Charts Depicts Bullish Crossover
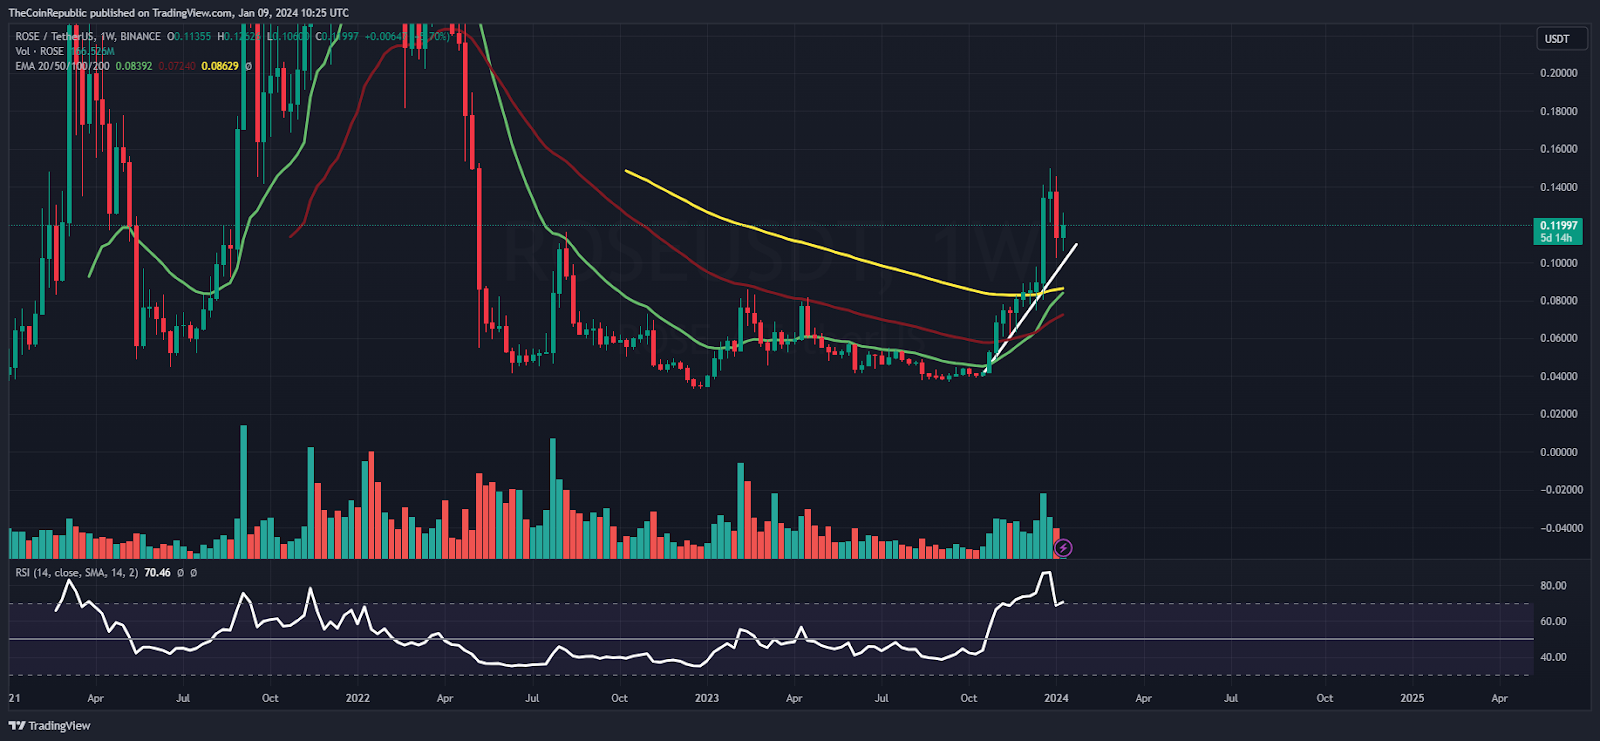
On the weekly charts, Oasis Network sparked bullishness and displayed a double-bottom breakout above the 100-day EMA barrier. A sharp reversal was also spotted, which delivers buyers’ willingness to reach the swing top of $0.17000 in the following sessions.
Summary
ROSE price showcased a retracement and is declining gains replicating profit booking in the recent sessions. Moreover, the trend showcased the top formation and buyers have been engaging in unwinding long positions because of fear.
Technical Levels
Support Levels: $0.1100 and $0.1000
Resistance Levels: $0.1260 and $0.1360
Disclaimer
The views and opinions stated by the author or any other person named in this article are for informational purposes only and do not constitute financial, investment, or other advice. Investing in or trading crypto or stocks comes with a risk of financial loss.

Nancy J. Allen is a crypto enthusiast, with a major in macroeconomics and minor in business statistics. She believes that cryptocurrencies inspire people to be their own banks, and step aside from traditional monetary exchange systems. She is also intrigued by blockchain technology and its functioning. She frequently researches, and posts content on the top altcoins, their theoretical working principles and technical price predictions.


