
 Home
Home News
News
- 1 The TAMA price is trading below the key moving averages, showcasing bearishness.
- 2 Tamadoge continuing the bearish trend breaking below the dynamic supports.
Tamadoge Price exhibited weakness down by more than 13% in a weak. Buyers tried their best to breach the key moving averages but faced rejection from the top. Bear has control of the price and is not in the mood to shift the power.
Tamadoge crypto price is facing strong bearish pressure on the daily technical charts, as it is trading below the key EMAs. The crypto has failed to break above its key resistance levels near the EMAs in the past few months, despite several attempts by buyers.
The crypto is currently trading near $0.007057, with a marginal loss of 0.16% in the intraday session. The crypto has potential upside targets but it needs to overcome the bearish momentum and surge above the major EMA curve. The crypto has a support level of $0.006000, which could prevent further upside.
Tamadoge price forecast suggests that the crypto is in the solid grip of the sellers and needs to show some indications of reversal before confirming a bullish trend.
The technical indicators favor the sellers projecting a negative outlook for the buyers. The RSI and stochastic RSI oscillators are moving near the overbought zone, whereas the major EMA lines act as barrier points for the TAMA price.
The TAMA’s performance could have been better throughout the year. It has suffered negative returns of 15.39% in the year-to-date period, 37.08% in the last six months, 22.45% in the last month, and 13.82% in the last week. That shows a persistent bearish trend, which has not reversed yet.
Technical Analysis of Tamadoge Crypto Price in 1-D Timeframe
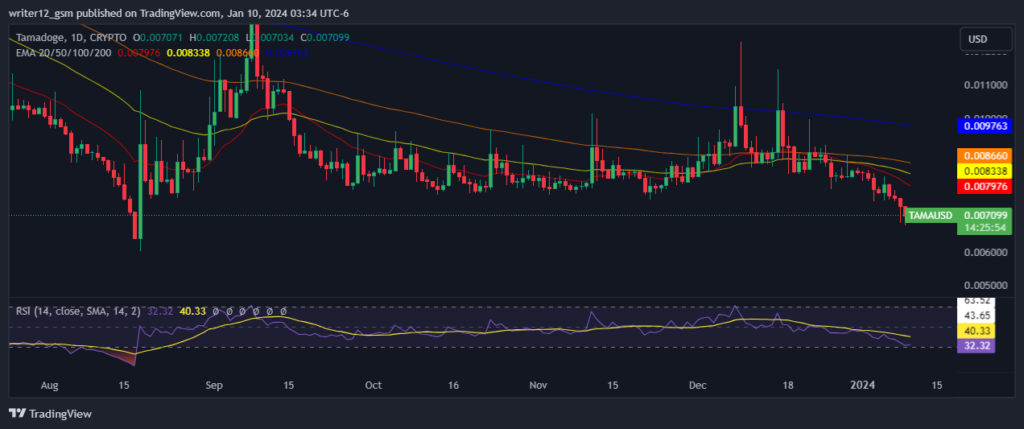
Tamadoge crypto (USD: TAMA) is trading under the 50 and 20-day DMAs (Daily moving averages), which are not upholding the price trend.
The current value of RSI is 32.17 points. The 14 SMA is above the median line at 40.33 points, which indicates that the Tamadoge crypto is bearish.
The MACD line at -0.000390 and the signal line at -0.000274 are below the zero line. A bearish crossover is observed in the MACD indicator which indicates more weakness for the TAMA cryptoprice.
Summary
Tamadoge’s price (USD: TAMA) technical chart supports the bearish trend. The MACD, RSI, and EMA emphasize positive signs and imply that the uptrend may continue in the TAMA crypto price. Tamadoge Price action suggests that the investors and traders are bearish on the 1-D time frame. The price action reflects a bearish perspective at the moment.
Technical Levels
Support Levels: The Tamadoge crypto price may find support at $0.006000 and $0.005000, where it could bounce back or stabilize.
Resistance levels: The TAMA crypto price may face resistance at $0.007979 and $0.008340, where it could reverse or consolidate.
Disclaimer
This article is for informational purposes only and does not provide any financial, investment, or other advice. The author or any people mentioned in this article are not responsible for any financial loss that may occur from investing in or trading. Please do your own research before making any financial decisions.

Adarsh Singh is a true connoisseur of Defi and Blockchain technologies, who left his job at a “Big 4” multinational finance firm to pursue crypto and NFT trading full-time. He has a strong background in finance, with MBA from a prestigious B-school. He delves deep into these innovative fields, unraveling their intricacies. Uncovering hidden gems, be it coins, tokens or NFTs, is his expertise. NFTs drive deep interest for him, and his creative analysis of NFTs opens up engaging narratives. He strives to bring decentralized digital assets accessible to the masses.


