


Litecoin price forecast is bullish in the present scenario and indicates the trend is turning bullish. However, the upper resistance level of $79.35 is the main hurdle for the coin in a bullish way.
LTC price has already taken multiple rejections from the supply zone of $76.00 to $79.34. However, the bulls are looking aggressive and trying to surpass the supply zone.
In recent trading sessions, buyers have demonstrated their strength. They also continued buying and accumulating more cryptocurrencies to extend the upward trend.
The price action suggests that the cryptocurrency is poised for a significant uptrend with a potential price increase in the coming sessions. Buyers are trying hard to maintain these levels and show confidence in the cryptocurrency’s upward direction.
Litecoin cryptocurrency indicates increased bull activity in the market. Moreover, the price action is still making higher highs and higher lows on the charts, indicating that the cryptocurrency is bullish and has no intention of slowing down.
The chart structure shows that buyers are driving the trend and the cryptocurrency is gradually approaching the $80 mark, which it is likely to reach soon in upcoming sessions. Additionally, sellers have found themselves in a defensive position after breaking multiple resistance levels above $75 with significant vertical gains over the last few trading sessions. Investors are showing strong intent to continue this upward trend.
At the time of publication, the Litecoin cryptocurrency was trading at $75.11 with an intraday increase of 4.48%, showing an optimistic outlook on the chart. It also has a trading volume of $733.894 Million and a market capitalization of $5.559 billion.
Technical Analysis of Litecoin Crypto Price in 1-D Timeframe
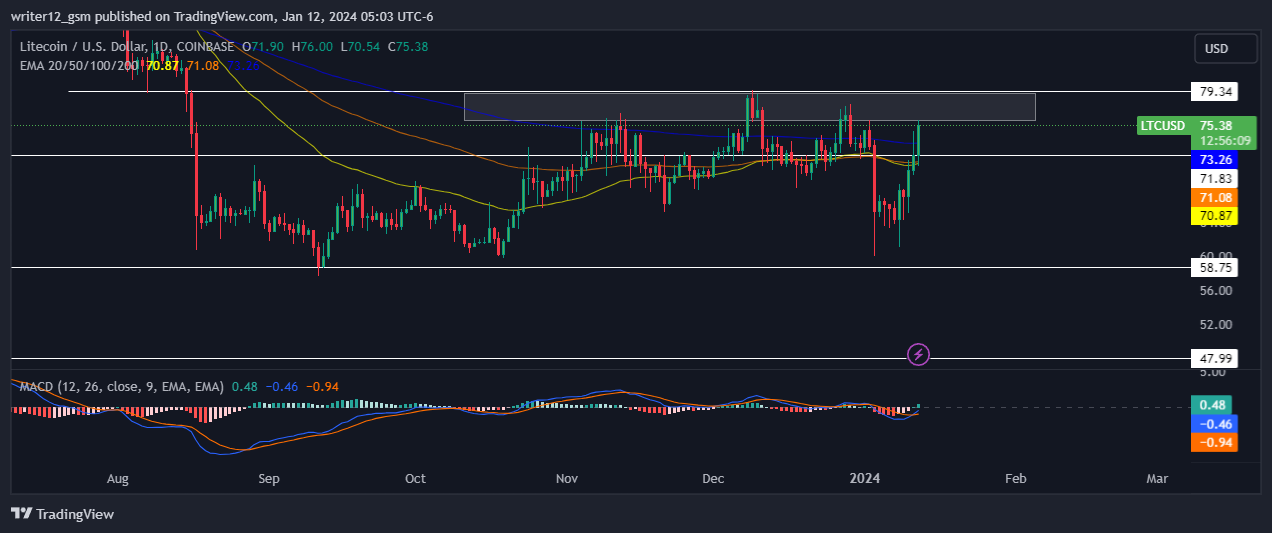
Litecoin (USD: LTC) is currently trading above its 50-day and 200-day daily moving averages (DMA), which supports its price momentum.
The MACD line at -0.47 and the signal line at -0.94 are above the zero line. There is a bearish crossover in the MACD indicator, which indicates weak momentum in the price of the LTC cryptocurrency.
The current RSI value is 59.56 points. The 14 SMA is above the center line at 45.68 points, indicating the bullish nature of the Litecoin cryptocurrency.
Conclusion
Technical ofLitecoin (USD: LTC) is sustaining the bullish trend. MACD, RSI, and EMA highlight optimistic signals, suggesting that the upward trend in the price of the LTC cryptocurrency may continue. The price action suggests that investors and traders are optimistic on a daily basis. Price directions mirror the current optimistic outlook. However, investors and traders must wait to be adequately prepared for the next step and avoid FOMO.
Technical Levels
Support Levels: $59.20.
Resistance Levels: $79.23.


