
 Home
Home News
News

- 1 VOLT price showcased a retracement move and has retested $0.0000003600.
- 2 Volt Inu price finally got rid of consolidation and is ready for a surge.
Volt Inu is a deflationary token on the Ethereum blockchain that continues to develop using genuine deflationary techniques and revenue generation. Moreover, the trend is neutral, and the VOLT token may attain momentum and will retain the swing high of $0.0000005000 soon. However, the investors have booked their profits during the rise and are waiting for a perfect opportunity to enter amidst volatility.

VOLT token price has decisively sustained gains above the key moving averages and implies buyers’ strength on the charts. Amidst the retracement from the top of $0.0000007500, the VOLT token is still a safe bet to go long based on its technical setup. Recently, the LUNA token enlisted a sharp bounce from the lower zone of $0.00000003000 and surged over 150%, displaying the pump and then dump.

At press time, the Volt Inu (VOLT) token trades at $0.0000004199 with an intraday drop of 1.03%, showing a retracement in the recent sessions. Moreover, the trading volume increased by 3.29% to $342,305, highlighting dull moves. The pair of VOLT/BTC was noted at 0.000000000930 BTC, while the market cap is $59.10 Million. Analysts are neutral and suggest that the VOLT Token price will continue to face volatility and may retest $0.00000007800 soon.
VOLT On Daily Charts Displays Range Breakdown
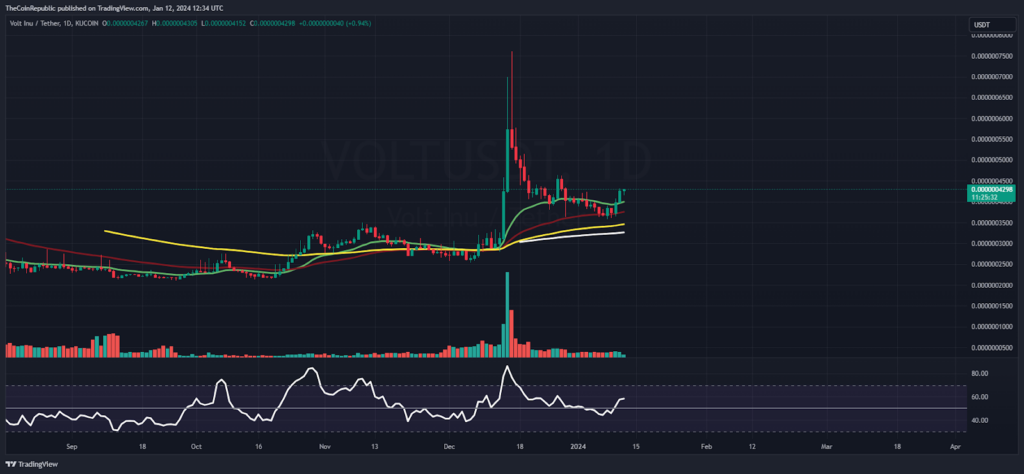
On the daily charts, the VOLT token price showcased retracement from the highs and is waiting for a pullback. Moreover, the price action shows the roller coaster move, attempting to shine above $0.00000004500 for a bullish rally. Amidst the positive market sentiment, VOLT price has rolled over 40% of its gains from the lows and exited the bearish trajectory.
The relative strength index (RSI) curve stayed close to 50 near the midline, indicating the buying momentum on the charts. Moreover, the MACD indicator showed a bullish crossover, suggesting buyers are keen to retest $0.00000004500 to reach the 52-week high mark.
VOLT On Weekly Charts Replicates Reversal
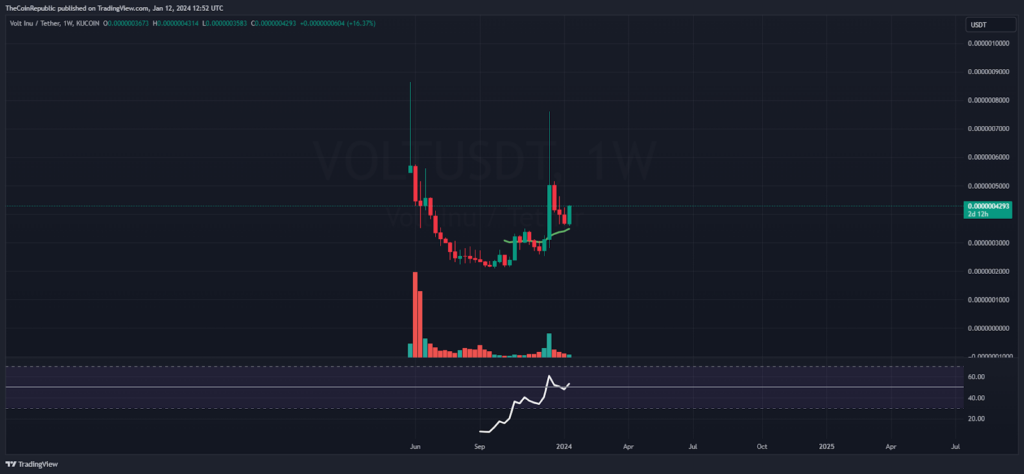
On the weekly charts, the VOLT price showcased the reversal and guided bullishness in the recent sessions. However, a rejection candle was spotted and sellers are trying to cover their positions, which recovered the Volt Inu token price from the lows and is ready to catch the upside.
Summary
Volt Inu (VOLT) price replicated an uptrend and showed a pullback from the 50-day EMA, displaying buyers’ interest in the recent sessions. Moreover, the technical indicators signify the positive sentiment, and the VOLT token may soon retest the swing of $0.00000004500.
Technical Levels
Support Levels: $0.00000004000 and $$0.00000003800
Resistance Levels: $0.00000004500 and $0.00000004700
Disclaimer
The views and opinions stated by the author or any other person named in this article are for informational purposes only and do not constitute financial, investment, or other advice. Investing in or trading crypto or stocks comes with a risk of financial loss.

Adarsh Singh is a true connoisseur of Defi and Blockchain technologies, who left his job at a “Big 4” multinational finance firm to pursue crypto and NFT trading full-time. He has a strong background in finance, with MBA from a prestigious B-school. He delves deep into these innovative fields, unraveling their intricacies. Uncovering hidden gems, be it coins, tokens or NFTs, is his expertise. NFTs drive deep interest for him, and his creative analysis of NFTs opens up engaging narratives. He strives to bring decentralized digital assets accessible to the masses.


