
 Home
Home News
News
- 1 Shiba Inu price is trading above the key moving averages supporting bullish momentum.
- 2 SHIB’s price recently took a reversal from the lower dynamic support.
- 3 Shib price forecast for JAN 2024 demonstrated a mild consolidation showing neutrality in the chart.
Shiba Inu price forecast for 2024 January indicates mild consolidation in the price. The bulls and bears are fighting over the price, despite this no one has a proper grip on the price.
In the recent sessions, the sellers have tried their best to pull the price down but failed in their attempts as the buyers are accumulating the crypto at lower levels.
At the time of writing the SHIB price is trading at the level of $0.000009803 with an intraday drop of 2.95%. It shows bears are aggressive in the recent sessions. The market cap is down by 2.97% and the volume is down by 16.70% in the previous 24 hours.
The 24-hour trading volume of SHIB crypto is 196.171 Million and the market capo of 5.781 Million. The coin has a fully diluted market cap of 5.783 Billion. The volume-to-market cap ratio of the coin is 0.0341. At the moment the coin is looking a little volatile as buyers and sellers are both trying to grasp the price.
The performance of the coin throughout the year is volatile and decent, as year-to-date it gave a return of 5.13%, in 6 months it gave a return of 24.97% and in the previous three months, it gave a return of 39.54%.
However, the coin has shown a little weakness in recent weeks as it gave a negative return of 0.10% last month and 0.20% last week.
As per the price action, the crypto is bullish in the long term despite the recent weakness. The price is currently taking support on the key moving averages and showcasing the bulls are supporting the price.
Will Shiba Inu Boost & Reach the upper levels?
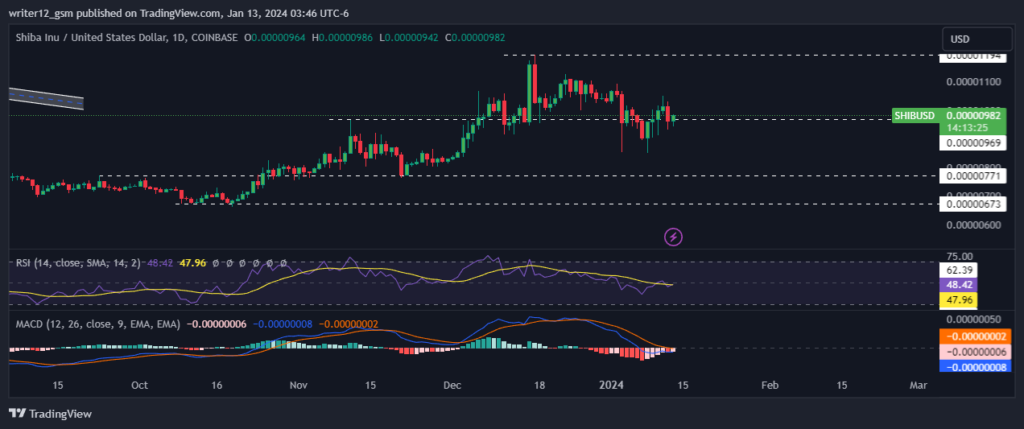
The SHIB price is currently hovering above the key moving averages, showcasing that buyers are still supporting the price. However, the price needs an influx of buyers to reach the upper levels and bounce back from the current levels.
The RSI curve is trading in the neutrality zone showing neither buyers nor sellers are in the momentum. The faith of the price will be decided by its direction in upcoming sessions.
The MACD is also hovering at the zero line showing neutrality in the trend. Overall, the Shiba Inu trend is neutral and traders and investors should wait for the proper direction of the price.
Moreover, if the price breaks the current dynamic supports, it might touch the lower levels soon. However, the buyers are still active on the lower levels so it is difficult to down the price.
Summary
The SHIB price forecast suggests that the price is trading in the consolidation and not giving a proper direction of the price. Ther key indicators like MACD, RSI, and the EMAs show neutrality on the daily charts. The price action suggests that the price might bounce back from the current levels soon and needs a good catalyst for that.
Technical Levels
Support– $0.00000771.
Resistance– $0.00001194.
Disclaimer
This article is for informational purposes only and does not provide any financial, investment, or other advice. The author or any people mentioned in this article are not responsible for any financial loss that may occur from investing in or trading. Please do your research before making any financial decisions

Amanda Shinoy is one of the few women in the space invested knee-deep in crypto. An advocate for increasing the presence of women in crypto, she is known for her accurate technical analysis and price prediction of cryptocurrencies. Readers are often waiting for her opinion about the next rally. She is a finance expert with an MBA in finance. Quitting a corporate job at a leading financial institution, she now engages herself full-time into financial education for the general public.


