
 Home
Home News
News
- 1 XRP price showcased lower low swings and is anticipating a down move.
- 2 Buyers were in trouble and started unwinding their positions slowly & steadily.
The XRP price retested the 200-day EMA mark and is on the verge of a breakdown. However, the buyers are trying to save the gains to prevent rash selloffs. In addition, lower tops and lower low swings display the selling pressure, and XRP price continues to distribute the gains amidst the positive market sentiment.
The XRP price action displays the long unwinding, and sellers are leading the battle now. Moreover, the trend showcases retracement and reveals neutrality, which led investors to square off their gains from the table. Furthermore, the symmetrical triangle pattern was noted, which shows that XRP is ready for a ride after a roller coaster move. Based on the technicals, the upside is capped, and XRP may soon retest the demand zone of $0.5000.
At press time, XRP trades at $0.57 with an intraday drop of 3.86%, showing selling pressure on the charts. Moreover, the trading volume increased by 5.44% to $1.59 Billion, highlighting bear dominance. The pair of XRP/BTC was noted at 0.0000134 BTC, while the market cap is $30.99 Billion. Analysts are bearish and suggest that the XRP price will continue to drag the gains and may breach $0.500 soon.
XRP On Daily Charts Displays Symmetrical Triangle Pattern
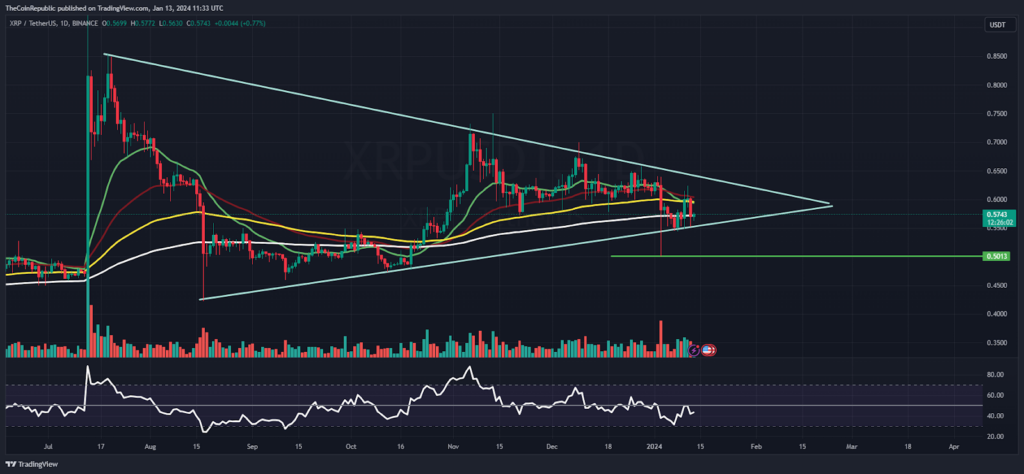
On the daily charts, XRP crypto showcased a symmetrical triangle pattern and is waiting for a sharp flow beyond the trendline hurdle. That may lead to a breakout or breakdown. The upper hurdle exists at $0.6500; above it, $0.6800 is possible, whereas the lower neckline of $0.5500 if breaches will drag to $0.5000.
The relative strength index (RSI) curve continued slipping from the top and is approaching the oversold region, which signifies the selling pressure in the recent sessions. The MACD indicator showed a bearish crossover and is revealing the underperformance.
Is XRP Ready For A Pullback From 200 Day EMA Mark?
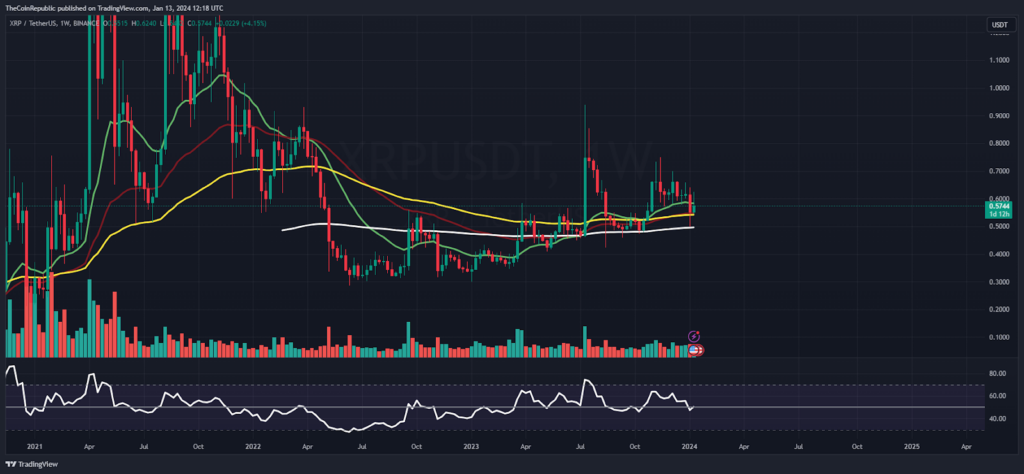
On the weekly charts, XRP price has retested the 200-day EMA mark. It reveals that buyers have failed to expand the bullish journey and are trying for a rebound. The XRP crypto seems overbought, which led to a healthy retracement in the recent sessions. Meanwhile, buying momentum is needed for a decisive pump above the crucial hurdle of $0.6200 to retain bullishness.
Summary
XRP crypto showcased a symmetrical triangle pattern and is ready for a blast in the upcoming sessions. Investors are closely tracking the counter and waiting to add fresh positions. Meanwhile, the trading volume did not justify the investor interest, which is a sign of selling pressure from the top.
Technical Levels
Support Levels: $0.05500 and $0.5200
Resistance Levels: $0.6000 and $0.6200
Disclaimer
The views and opinions stated by the author or any other person named in this article are for informational purposes only and do not constitute financial, investment, or other advice. Investing in or trading crypto or stocks comes with a risk of financial loss.

Nancy J. Allen is a crypto enthusiast, with a major in macroeconomics and minor in business statistics. She believes that cryptocurrencies inspire people to be their own banks, and step aside from traditional monetary exchange systems. She is also intrigued by blockchain technology and its functioning. She frequently researches, and posts content on the top altcoins, their theoretical working principles and technical price predictions.


