
 Home
Home News
News
- 1 UNI price somehow broke the lower trendline and slipped below $7.
- 2 Buyers are in trouble and could try to surpass the hurdle of $6.80 to retain $7.
Uniswap (UNI) is the native token of the Uniswap protocol and provides its holders with governance rights; UNI holders can vote on changes to the protocol. Uniswap is an automated liquidity protocol that allows anyone with an Ethereum wallet to exchange tokens without the involvement of any central party. Uniswap price was enduring in extending the gains inside the rising channel, but a sudden breakdown was witnessed, and UNI slipped below $7. However, the follow-on selling was not too sharp and somehow buyers managed to pause the selloff near the 100-Day EMA.
Uniswap (UNI) price was trading in an uptrend and is showing a sudden juncture below the 20-Day EMA. However, the UNI price is attempting a rebound and faced rejection near the $6.70 mark. Per the technicals, UNI price shows a pullback from the 100-Day EMA and is likely to trap the sellers. Meanwhile, the sudden breakdown and a pullback exhibit extreme volatility. Investors are cautious now and waiting for an apparent move to add positions.

Uniswap (UNI) price was $6.60 at press time with an intraday gain of 1.05%, showing neutrality on the charts. Moreover, the trading volume increased by 4.20% to $142.89 Million, highlighting a pullback. The pair of UNI/BTC was noted at 0.000154 BTC, while the market cap is $5.72 Billion. Analysts are bullish and suggest that the UNI price will attain a rebound and may surpass $8.00 soon.
UNI On Daily Charts Displays Channel Breakdown
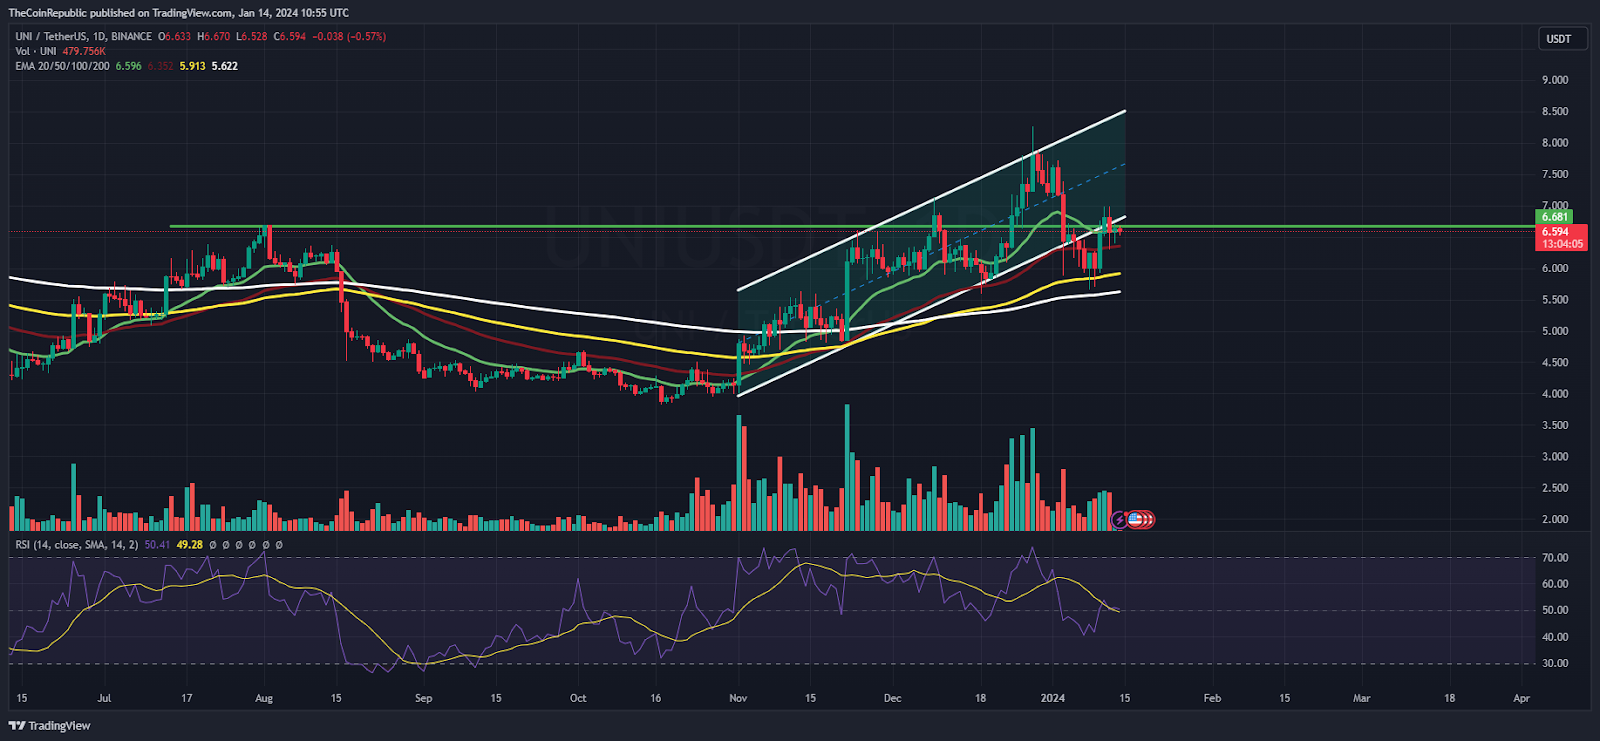
On the daily chart, Uniswap price action showcased volatility and is waiting for a rebound to surpass the 20-Day EMA. Still, the buying momentum exists, and the UNI price may continue to shine above $7. However, the trading volume is below average, which hints at uncertainty among investors.
The relative strength index (RSI) curve stayed close to the midline and delivered a volatile outlook in the recent sessions. The MACD indicator showcased convergence of the MA line with the signal line and did not signify a clear view.
UNI On Weekly Chart Exhibits Rejection From 100-Day EMA
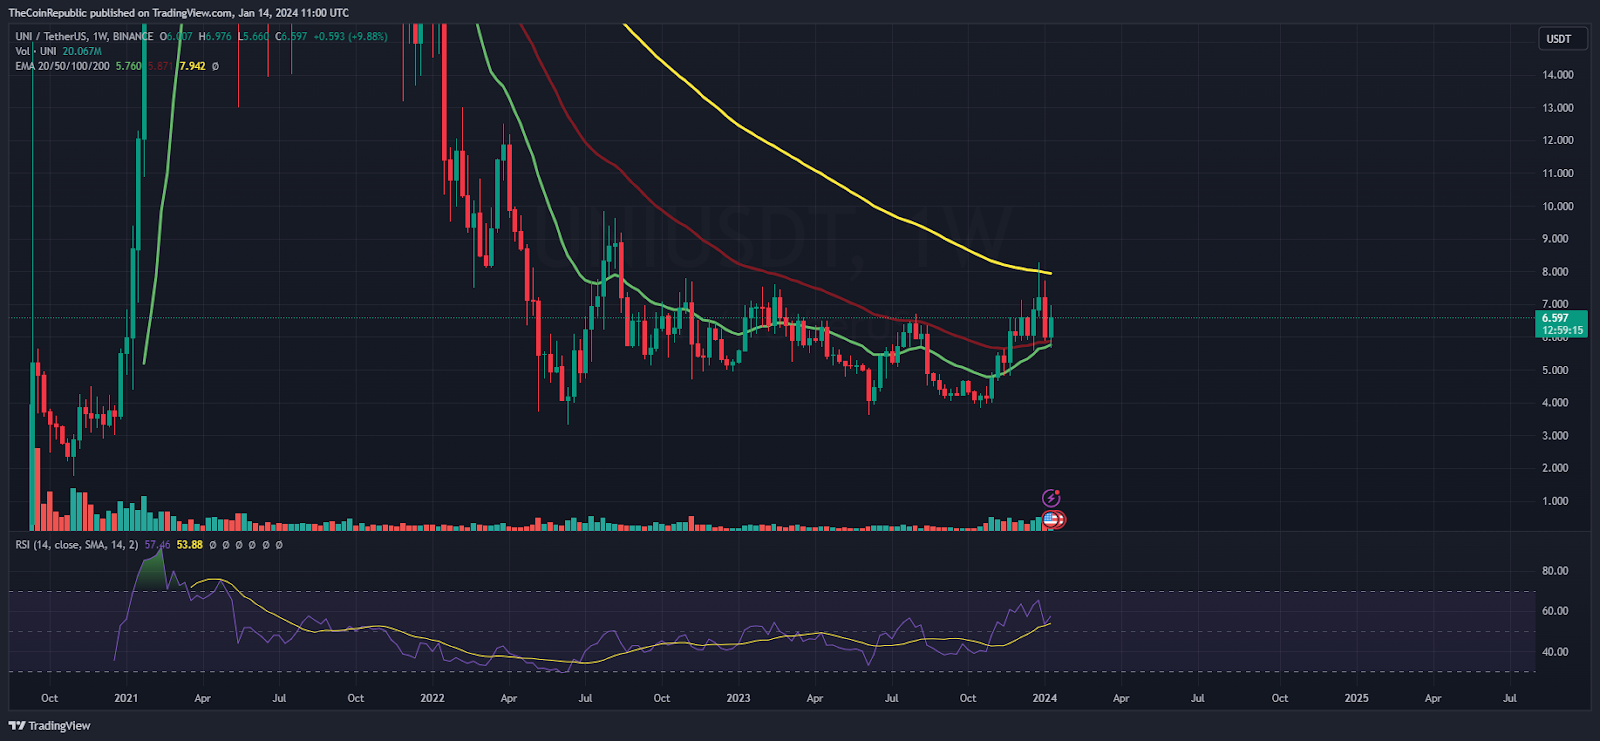
On the weekly charts, Uniswap (UNI) has broken the downward-sloping trendline hurdle and has gained momentum in recent sessions. However, the rally was not sustained at the highs near $8, and a sharp throwback from the 100-Day EMA was witnessed, which redirected the UNI price below $7.
Summary
Uniswap (UNI) faced a breakdown and slipped below the channel lows of $7, redirecting selling pressure in the recent sessions. UNI price is close to the resistance mark of $7. If UNI price surpasses the $7 mark, it will again reach $8 and will continue to accumulate gains.
Technical Levels
Support Levels: $6.30 and $6
Resistance Levels: $7.10 and $7.50
Disclaimer
The views and opinions stated by the author or any other person named in this article are for informational purposes only and do not constitute financial, investment, or other advice. Investing in or trading crypto or stocks comes with a risk of financial loss.

Steefan George is a crypto and blockchain enthusiast, with a remarkable grasp on market and technology. Having a graduate degree in computer science and an MBA in BFSI, he is an excellent technology writer at The Coin Republic. He is passionate about getting a billion of the human population onto Web3. His principle is to write like “explaining to a 6-year old”, so that a layman can learn the potential of, and get benefitted from this revolutionary technology.


