
 Home
Home News
News
- 1 The XLM crypto asset is expressing bearish behavior and shows that it has the potential to fall further on the daily chart.
- 2 The XLM price has been trading in a sideways range, showing signs of liquidity accumulation.
Stellar is a delegated blockchain network that motivates its users and businesses to transfer money and other assets across the world. Stellar provides many useful features such as remittances, micropayments, mobile money, and mobile banking.
It was made to allow quick and affordable cross-border transactions without relying on economic intermediaries. Furthermore, the public cryptocurrency of the network is Lumen (XLM), which is presented as a strong asset for network operations.

Additionally, Lumen (XLM) plays a significant role in the Stellar network, because at least a small amount of Lumen must always be held in each account to gain profits according to the least requirement and payout of the transaction fee.
Analyzing Stellar Crypto’s Symmetrical Triangle Breakout Potential
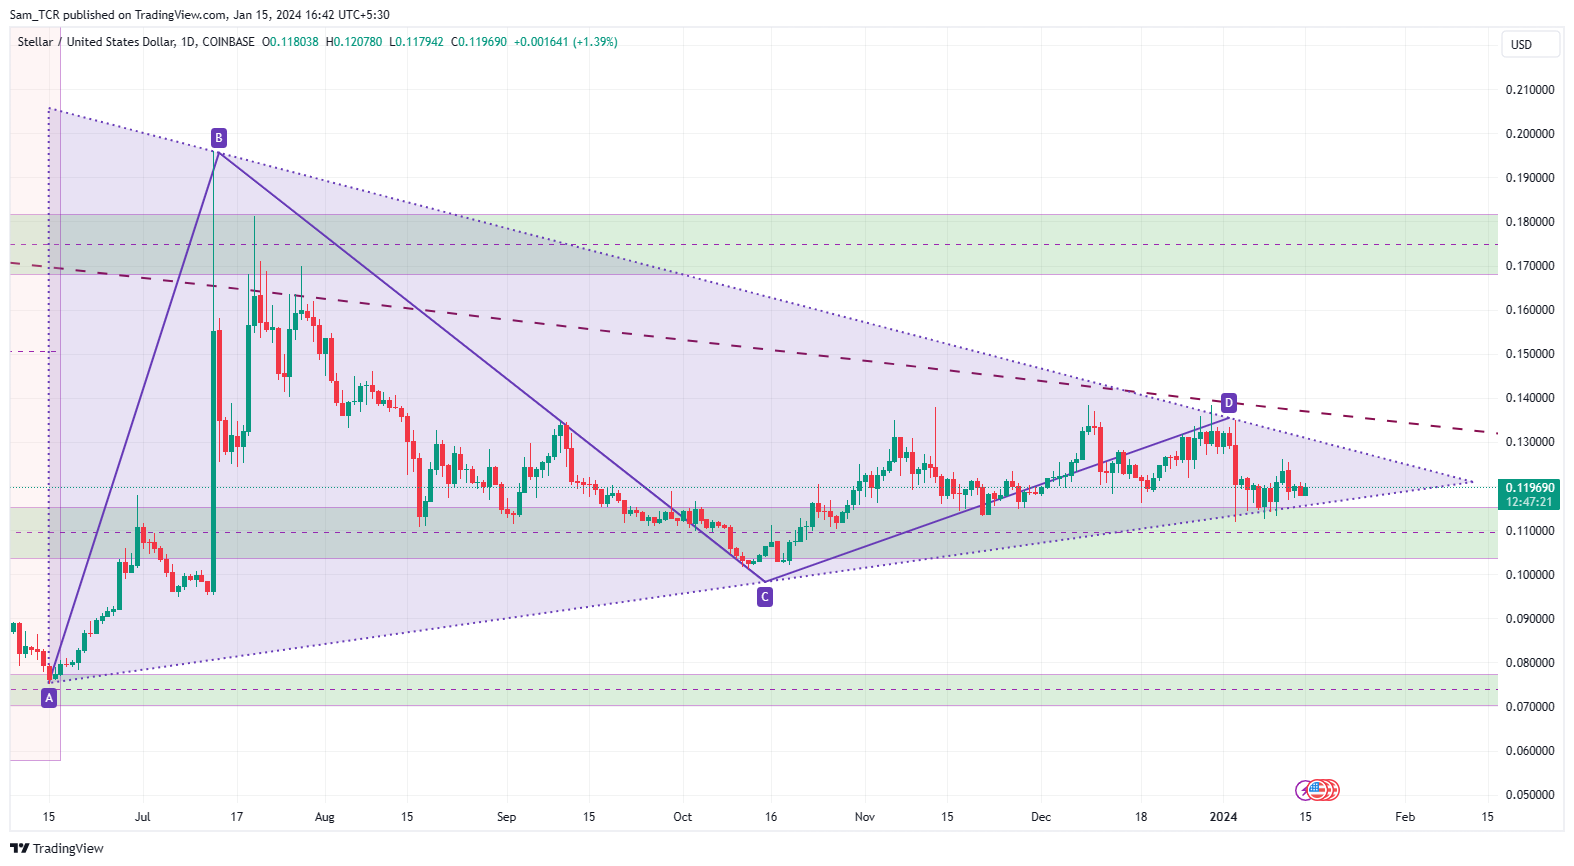
The XLM crypto asset is expressing bearish behavior and shows that it has the potential to fall further on the daily chart.
Since it had performed badly on the chart from March 2022 to June 2023, it was below the dominant trendline and during this period, it slumped greatly by around 70%, reflecting a stable downward trend.
In June 2023, the price attempted to surge from very low levels, around the demand zone at $0.07700, and it surged very fast on the daily chart. It reached the dominant trendline, but it struggled for some time hoping to surpass this level, but could not do so and fell again. This confirmed the stable downtrend.
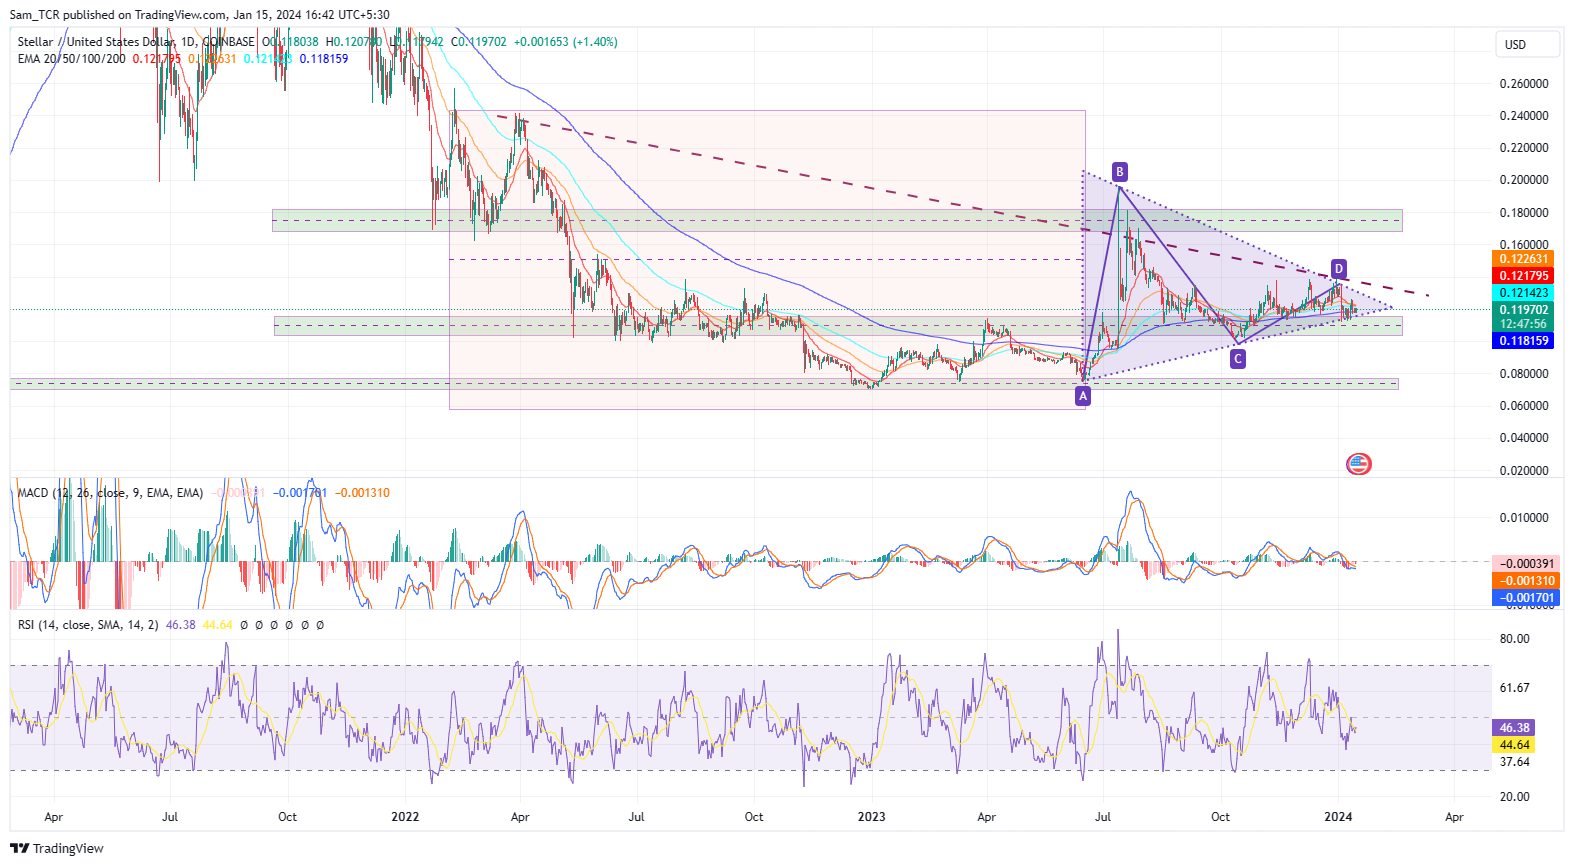
For a couple of months, the XLM crypto has been trading in a sideways range, showing signs of liquidity accumulation. It is also forming a symmetrical triangle on the chart, which is a non-biased 50-50 chart pattern.
There are strong possible chances that the XLM price could drop drastically, as the trendline aura is extremely dominant, and no hopes of an uptrend seem plausible.
The EMAs are all moving together and show no signs of clarity. However, the RSI and MACD prove our point, as the RSI is below the median line and the MACD is in a bearish cross. The overall technical analysis of XLM highlights strong bearishness.
Therefore, if XLM slips to the immediate level, it could go to $0.07000 and alternatively, if it goes upward after taking support from an immediate level, then the possible resistance is $0.160000.
Summary
The XLM crypto asset is expressing bearish behavior and shows that it has the potential to fall further on the daily chart.
Therefore, if XLM slips to the immediate level, it could go to $0.07000 and alternatively, if it goes upward after taking support from the immediate level, then the possible resistance is $0.160000.
Technical Levels
Support Levels: $0.07000
Resistance Levels: $0.160000
Disclaimer
In this article, the views, and opinions stated by the author, or any people named are for informational purposes only, and they don’t establish the investment, financial, or any other advice. Trading or investing in cryptocurrency assets comes with a risk of financial loss.

Amanda Shinoy is one of the few women in the space invested knee-deep in crypto. An advocate for increasing the presence of women in crypto, she is known for her accurate technical analysis and price prediction of cryptocurrencies. Readers are often waiting for her opinion about the next rally. She is a finance expert with an MBA in finance. Quitting a corporate job at a leading financial institution, she now engages herself full-time into financial education for the general public.


