
 Home
Home News
News
- 1 Aave price gained ground near the 50-Day EMA over the daily chart and climbed higher.
- 2 The price broke out of a falling wedge on the 4-hour chart.
Aave price gained ground yesterday near the 50-Day EMA and edged higher early Tuesday and followed through. A breakout of the falling wedge pattern was noted on the 4-hour chart which may help AAVE price regain traction and surge further.

Moreover, the short term outlook seems to be a bit neutral as AAVE crypto price is hovering in a range bounded zone over the four-hour timeframe. The bulls and bears are in a tough fight and attempting to tilt the trend in their favor.

Aave Cryptocurrency Volume Analysis
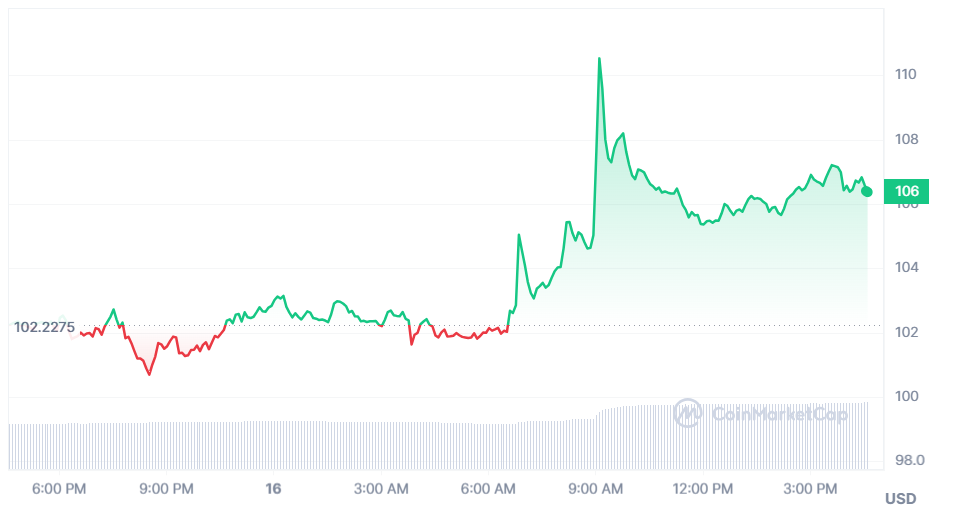
Moreover, the price rise is supported by a 49.29% rise in the volume in the past 24 hours suggesting the possible continuation of the short term positive bias. At the time of writing, the AAVE cryptocurrency was hovering near $106.36 with a 3.77% intraday rise.
It has a total market cap of $1.5 Billion and ranks 49th among all cryptos. Moreover, the volume to market cap ratio is 10.56% highlighting mild volatility.
Technical Analysis
AAVE/USD price has been in a bullish trend since November 2023, rising from around $40 to over $100. Moreover, the price has recently broken above a symmetrical triangle pattern, highlighting the strength of the prevailing bullish trend.
However, there are also some risks and challenges for the bullish scenario. The price is currently facing resistance from the 0.786 Fibonacci retracement level of around $105.
Also, the level coincides with the upper boundary of the bollinger band indicator, thus, confirming that it is a hurdle for the price.
Moreover, the RSI indicator is showing a bearish divergence signifying a loss of momentum in buying and a possible reversal in the trend.
At the time of writing, RSI was at 51.89, slightly above the mean line showing swift bullish bias. Therefore, traders and investors should be cautious and watch for the price action to form around the $105 level.
A breakout above this level would confirm the bullish trend and open the way for further upside potential for Aave crypto Investors. A breakdown below the above mentioned level would invalidate the pattern and suggest a deeper correction or a trend reversal.
Aave Price Prediction January 2024
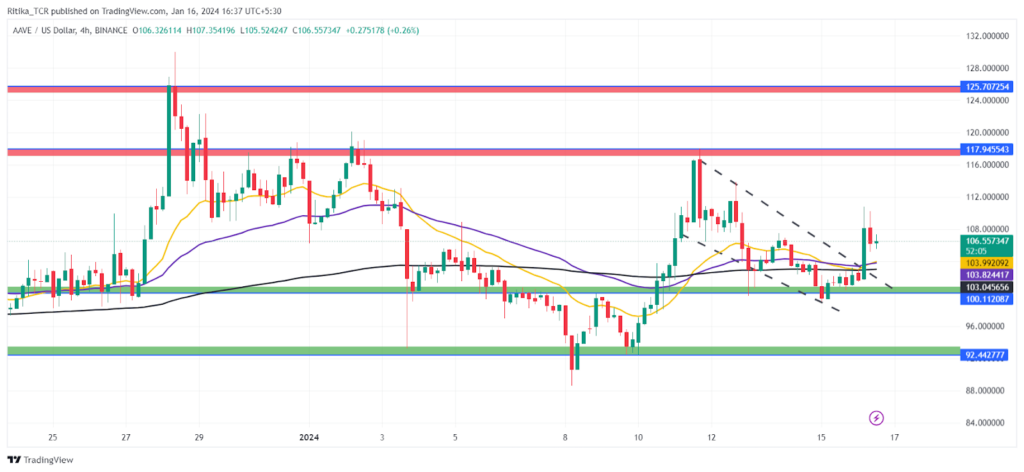
The long-term trend for the AAVE crypto is positive which may attract the buyers at the lows to resume its bullish trend. As the most optimistic view of our analysts, the AAVE price could reach a high of $121.82 by the month end.
The bearish view of analysts hopes for a breakdown below the 50-Day exponential moving average over the daily chart after which the price may drop to a low of $93.02.
Aave Price Prediction 2024
The price prediction for 2024 shows that Aave crypto may advance to a high of $172.10 by the end of year 2024. Whereas, the less optimistic analysts estimate a price target of $139.08 by the end of year 2024.
Aave Price Prediction 2025
By the next two years, the Aave cryptocurrency may attain $238.4 suggesting an upside potential of 124.05%. The most pessimistic view expects the price could reach $173.62 by the end of the financial year 2025.
Disclaimer
The views and opinions stated by the author, or any people named in this article, are for informational purposes only and do not establish financial, investment, or other advice. Investing in or trading crypto or stock comes with a risk of financial loss.

Andrew is a blockchain developer who developed his interest in cryptocurrencies while pursuing his post-graduation major in blockchain development. He is a keen observer of details and shares his passion for writing, along with coding. His backend knowledge about blockchain helps him give a unique perspective to his writing skills, and a reliable craft at explaining the concepts such as blockchain programming, languages and token minting. He also frequently shares technical details and performance indicators of ICOs and IDOs.


