
 Home
Home News
News
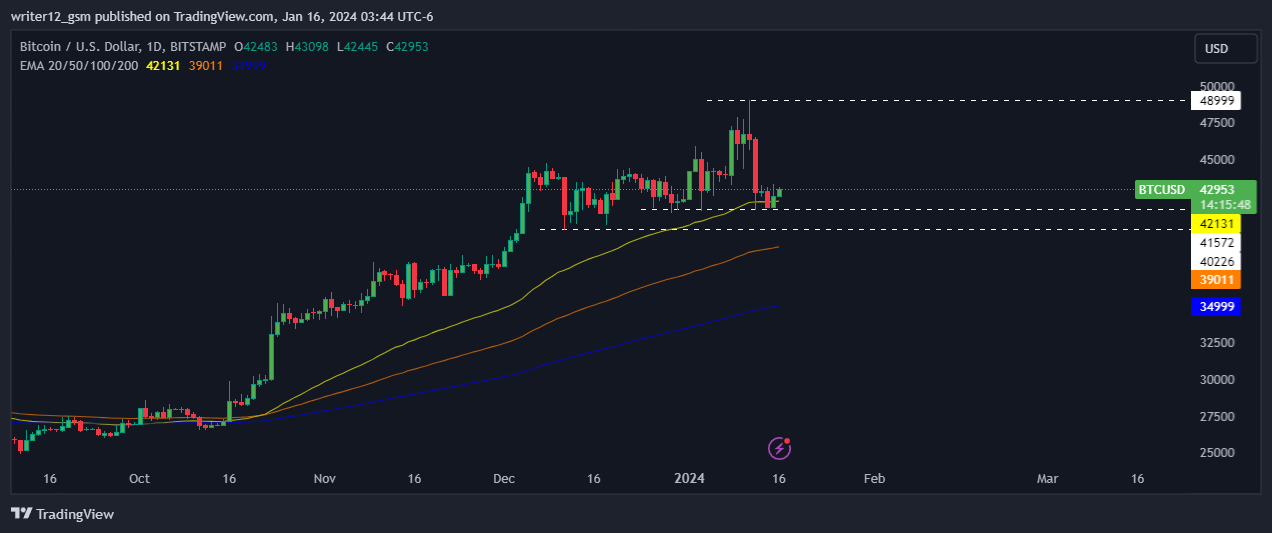
- 1 Bitcoin price is trading above the key moving averages despite weakness in the trend.
- 2 Bears were trying to bring down the BTC price, looking aggressive in the previous few sessions.
- 3 Before the correction, the BTC price Peaked at a value of $49,000 level.
Bitcoin price witnessed a roller coaster ride in recent months and showed many ups and downs. However, the price failed to smash the resistance zone of $50,000. The price peaked at the level of $49,000 and declined from there.
Moreover, the price broke below the critical support level of $45,000, decreased by over 12%, and tested the lower level of $41,500. The low was touched close to $41,476 and from there the price started to recover, showing a minor growth over the resistance zone of $42,000.
At the time of writing, the BTC is trading at the level of $42,944.17 with a growth of 0.85%. Its volume has increased by 3.55% in the intraday session. The company’s current market cap is 840.562 Billion and the 24-hour trading volume is 20.726 Billion.
The performance of the coin is volatile throughout the year as it gave a return of approximately 105.43% over the year and a 1.50% return year to date. It gave a return of 43.37% in the previous 6 months, and in the last 3 months, it gave a return of 50.99%.
However, the price is in the correction phase as it decreased by 8.79% in the last week, demonstrating a bear’s presence in the price. Buyers are accumulating the crypto at the range of $42,000 to $42,500, showing the tough battle between the bears and bulls.
As per the technical data of the trading view out of 26 indicators, 9 are on the sell side, 7 are on the neutral side, and 10 are on the buying side showing the neutral perspective.
What Will be the Direction of BTC in the Next Trading Sessions?
If the BTC price fails to surge above the current levels, it might start a fresh decline and might touch the lower levels in the next few sessions. However, the possibility of this looks low because the buyers are accumulating the crypto at lower levels.
Despite the recent weakness the price is still trading above the key moving averages of 50, 100, and 200-day EMAs. The price is taking a support on the 50-moving average. If the price breaks the 50 Moving average level, it might touch the level of $40,000 and that is also a psychological level.
The MACD is trading in the bullish zone but heading in the downward direction, red bars are noticed in the chart showcasing bearishness.
The RSI is hovering at the level of 47.76 below the 14-SMA curve, demonstrating the neutral outlook for the price.
Overall the key indicators like EMAs, MACD, and RSI are giving neutral perspectives, suggesting the investors should wait for the proper direction of the price for the next move.
Summary
The Bitcoin price forecast demonstrates a bounce back after a correction phase. The key indicators like MACD, RSI, and EMAs are indicating mild signs of bounce back from current levels.
Technical Levels
Support: $41,500.
Resistance: $43,500.
Disclaimer
The analysis provided in this article is for informational and educational purposes only. Do not rely on this information as financial, investment, or trading advice. Investing and trading in crypto involves risk. Please assess your situation and risk tolerance before making any investment decisions.

Nancy J. Allen is a crypto enthusiast, with a major in macroeconomics and minor in business statistics. She believes that cryptocurrencies inspire people to be their own banks, and step aside from traditional monetary exchange systems. She is also intrigued by blockchain technology and its functioning. She frequently researches, and posts content on the top altcoins, their theoretical working principles and technical price predictions.


