
 Home
Home News
News

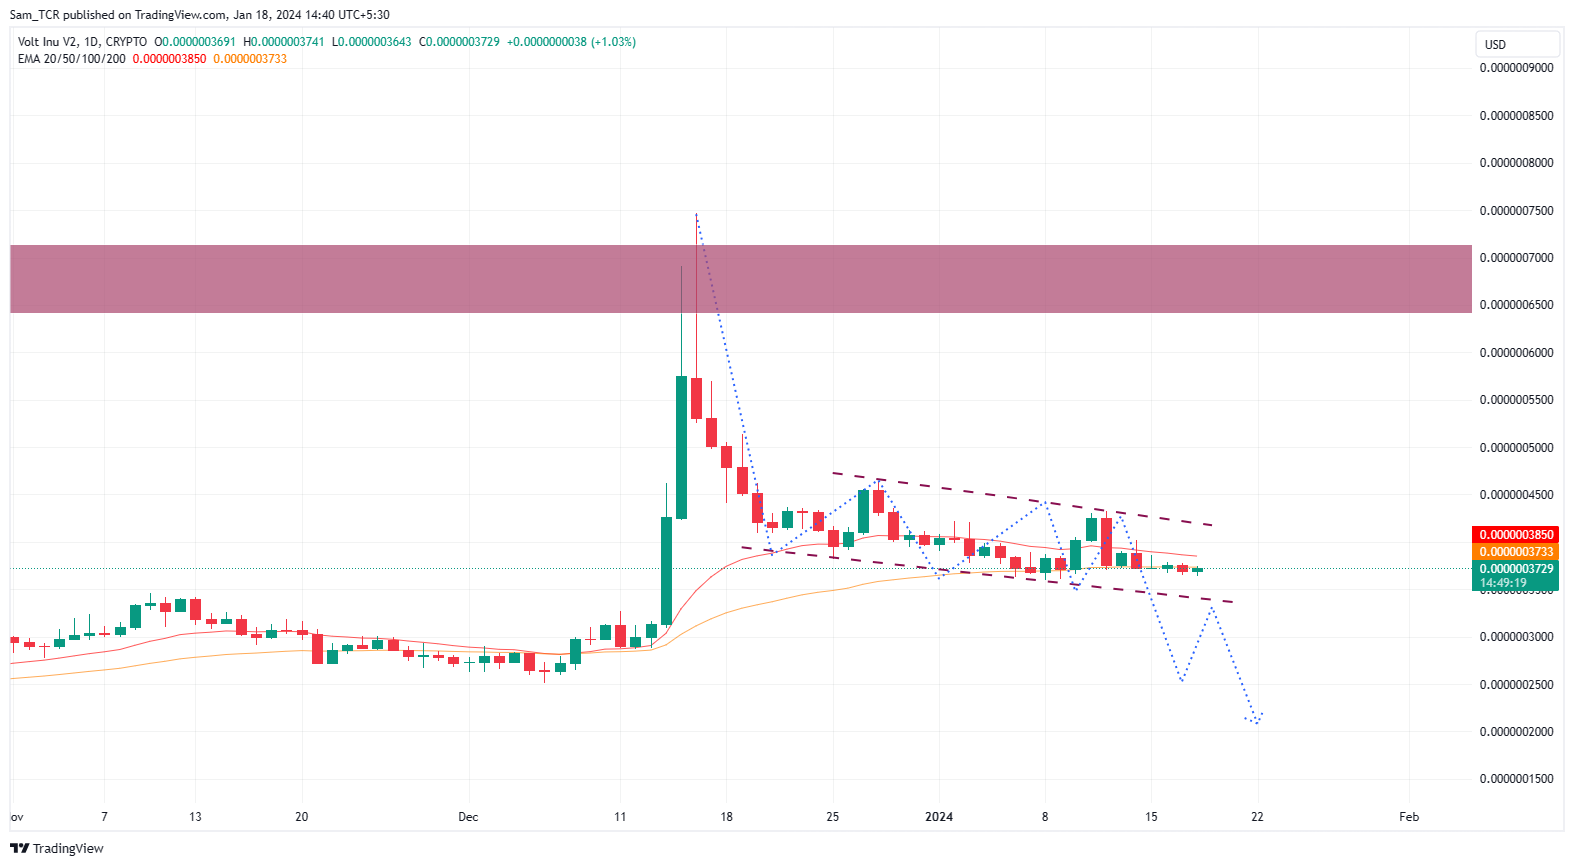
- 1 The VOLT price action is in a strong downtrend – making lower highs and lower lows pattern on the chart.
- 2 The histogram looks bearish and wide, displaying that the downtrend momentum is dominant.
Volt Inu is a crypto project that is founded based on a meme that aims to be the footing of crypto growth by using two principal strategies: first by the means of the burn mechanism and second by the process of reflection mechanism.

To be precise, the burn mechanism usually functions by declining the total supply of Volt Inu tokens (VOLT) over a certain time, creating an insufficiency and increasing its value.

Furthermore, the reflection mechanism rewards VOLT holders with a certain fixed percentage of every transaction fee, this acts as a passive income to its users and encourages holding.
Can VOLT Crypto Break Out Of the Wedge Soon Or Decline?
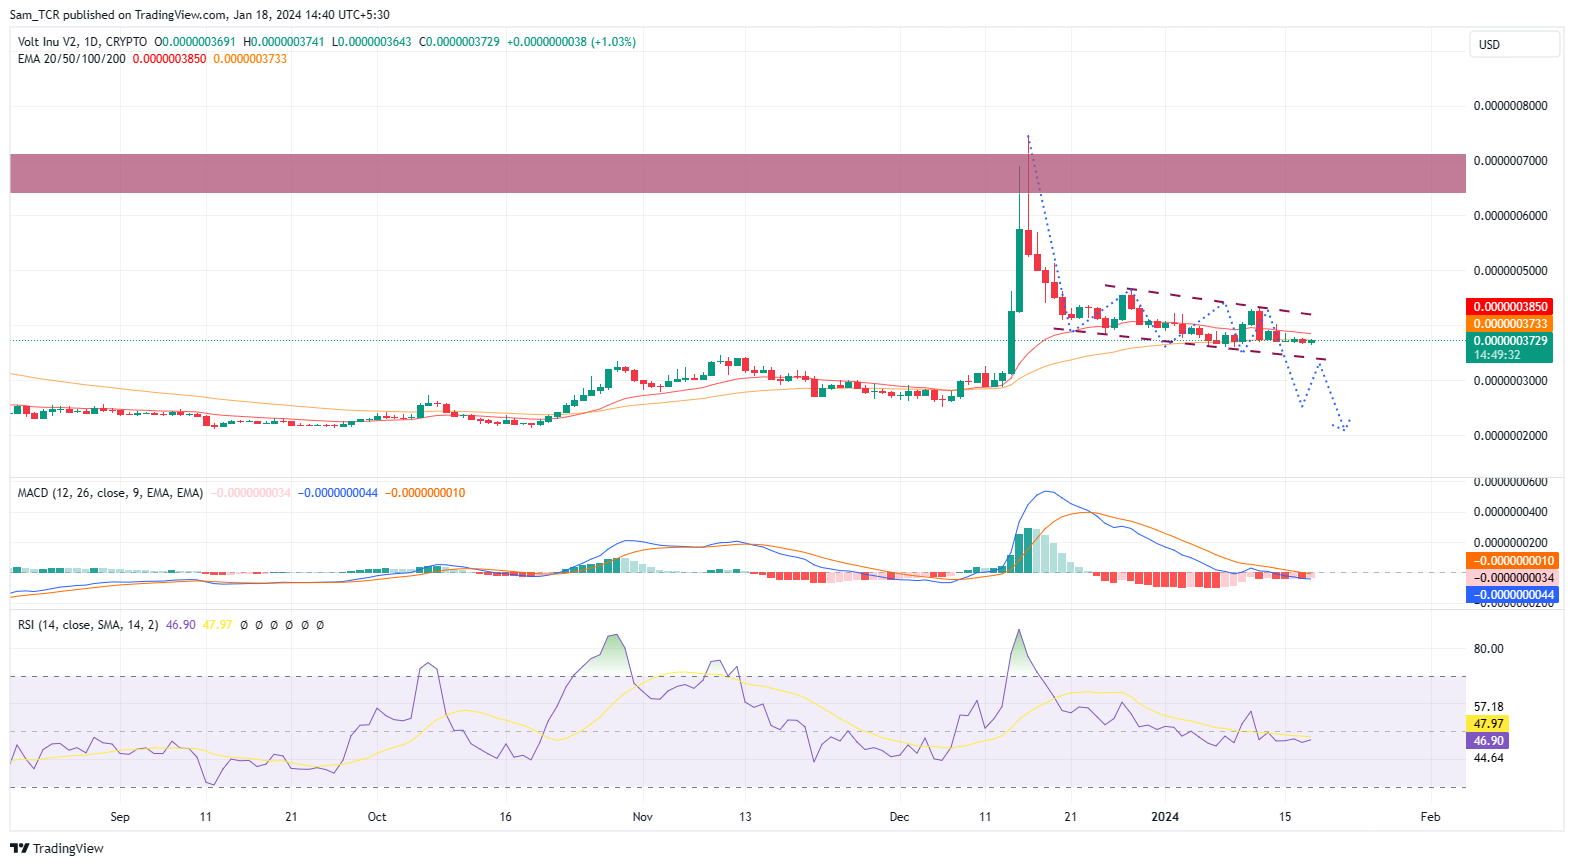
The VOLT price action is in a continuous downtrend from the price level of $0.0000007000 making lower highs and lower lows pattern on the chart and it is seamlessly following the downward wedge.
The CMP of VOLT is at $0.0000003728, which is beneath the major EMAs. The EMAs are sloping downside, which confirms the downside trend.
The VOLT price is also beneath the pivotal point, which is at $0.0000004000, which is a crucial level of resistance as well. Therefore, if the buyers increase, then the VOLT price could face resistance at $0.0000004600, which is the R1 level of the pivot points.
On the other side, if the sellers surge consistently, then the VOLT price could find support at $0.0000002600, which is the S1 level of the pivot points.
The VOLT price could also reach the demand zone if VOLT manages to breach S1, which is between $0.0000002000 and $0.0000002400, where the buyers could possibly enter the market.
Moreover, the MACD indicator is bearish and beneath the zero line, signifying that the sellers are in total control. The MACD line is at -0.0000000044, and the signal line is at 0.0000000010.
Meanwhile, the MACD line and the signal line have earlier crossed each other, this exhibited earlier a bearish trend signal that suggests a further decline in the VOLT price. The histogram is also bearish and wide, displaying that the downtrend momentum is dominant.
The 14 SMA is at 47.97, this shows that the VOLT price is losing steam and approaching the oversold zone. The RSI is also facing resistance from the 14-period simple moving average (SMA), which is at 46.85. This highlights that the VOLT price is having difficulty in piercing through the above SMA, which is a sign of strong weakness.
Summary
Based on the technical examination of the VOLT crypto, the overall sentiment for VOLT crypto assets is negative and bearish.
The VOLT price is most likely to continue its downside trend and touch the nearest support levels unless it breaches the nearest resistance levels and turns the trend around.
Technical Levels
Support Levels: $0.0000002600
Resistance Levels: $0.0000004600
Disclaimer
In this article, the views, and opinions stated by the author, or any people named are for informational purposes only, and they don’t establish the investment, financial, or any other advice. Trading or investing in cryptocurrency assets comes with a risk of financial loss.
Steve Anderson is an Australian crypto enthusiast. He is a specialist in management and trading for over 5 years. Steve has worked as a crypto trader, he loves learning about decentralisation, understanding the true potential of the blockchain.


