
 Home
Home News
News
- 1 WAVES crypto shows a retracement and is hovering near the 20-day EMA.
- 2 The WAVES price faced rejection from the supply zone of $3 and displayed a throwback.
The WAVES token showcased a reversal from the top and witnessed a trendline breakdown in the recent sessions. Moreover, the buyers have exhausted their strength and are struggling to hold the 20-day EMA mark. Meanwhile, the trend now signals a caution for investors. Despite the rebound from the demand zone, buyers failed to crack the supply zone and are displaying sellers’ grip near $3.
The WAVES price action signals that sellers are now engaging in adding short positions and are keen to force the token price toward $2. Meanwhile, the prompt support zone of $2.20 must be split to click a fresh selloff. Per the technicals, the token is forming the uncertain candlestick and is delivering consolidation amidst the uptrend. Along with the retracement, the token has now ended the higher high and remarked lower high, which creates pressure on bulls.

WAVES (Waves) token price was at $2.40 at press time, with an intraday drop of 1.20%, showing a retreat in the recent session. Moreover, the trading volume increased by 12.30% to $23.74 Million, highlighting bearish action. The pair of WAVES/BTC was noted at 0.0000465 BTC, while the market cap is $271.89 Million. Analysts are neutral and suggest that the token price will retest $2.00 soon.
WAVES on Daily Charts Displays Rejection
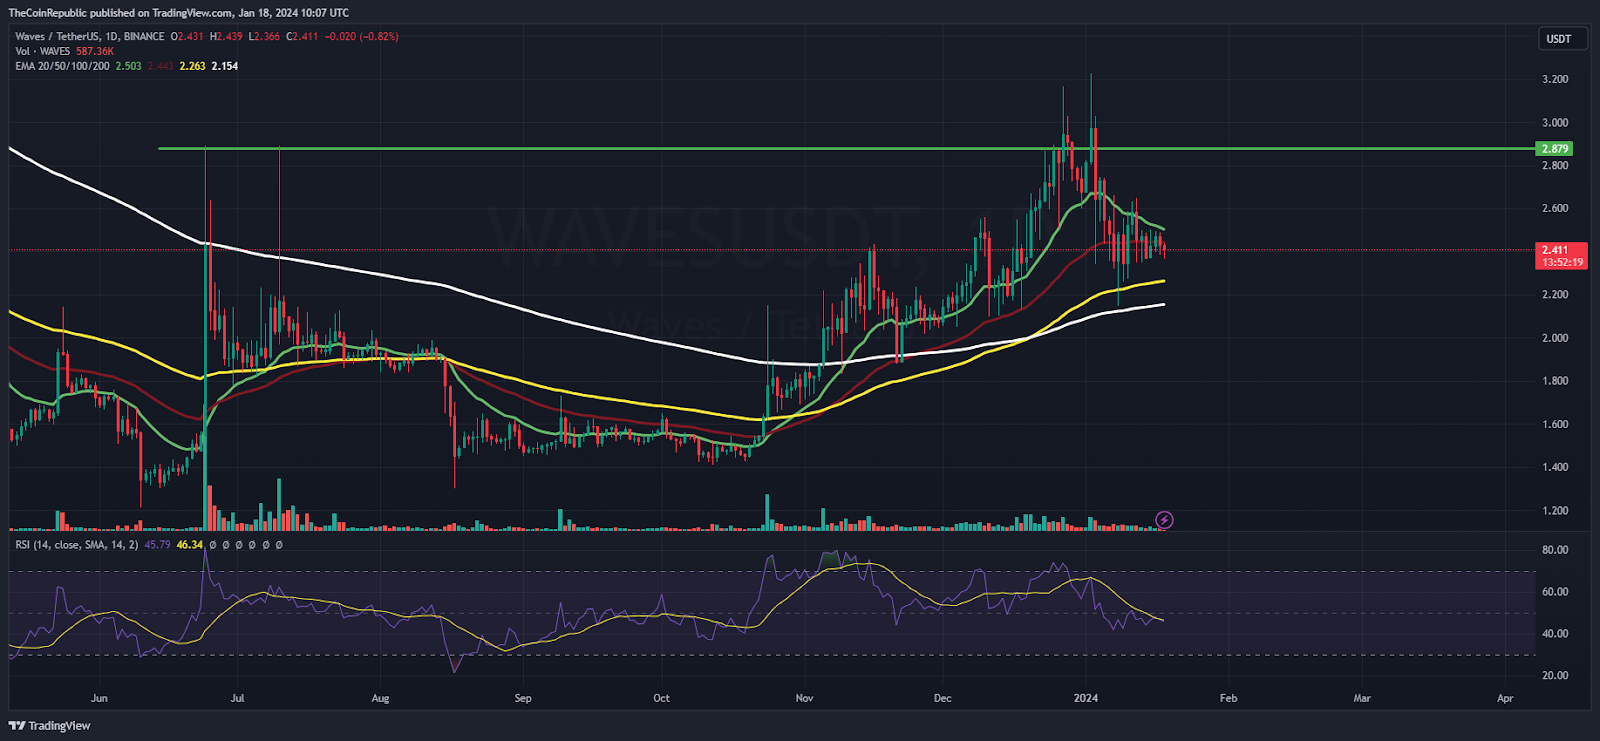
On the daily charts, the WAVES crypto has failed to sustain near the supply zone of $3 and is revealing retracement in the recent sessions. Moreover, the sellers are retaining the momentum and trying to force the token to retest the 200-day EMA mark. However, the 38.2% Fibonacci support zone exists at $2.20, which needs to be held.
The relative strength index (RSI) curve stays below the midline and shows a negative divergence, which directs the selling pressure. Moreover, the MACD indicator showed a bearish crossover. Besides, the token may face correction in the following sessions.
WAVES On Weekly Charts Exhibits Sharp Rejection From $3
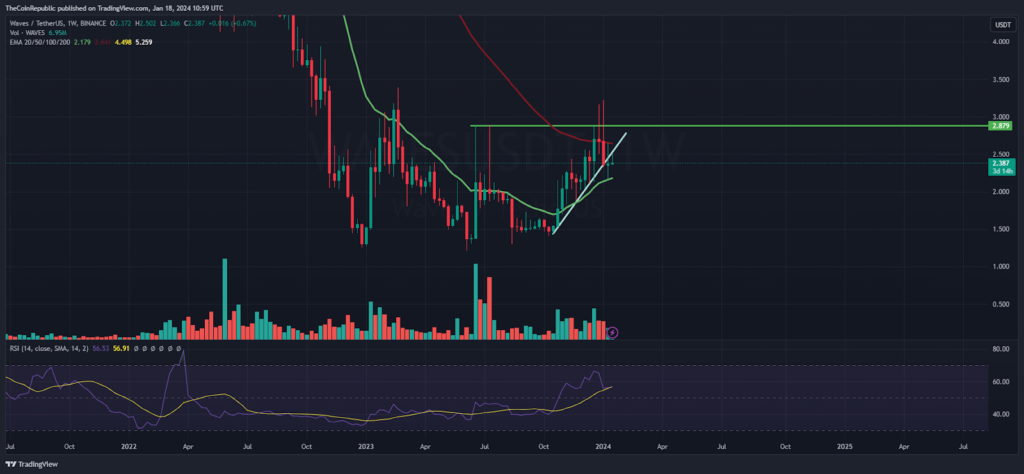
The WAVES crypto displayed a classic W pattern on the weekly charts and faced a sharp rejection from the 50-day EMA mark. A bearish doji candlestick was plotted, which is a sign of rejection. Additionally, the token displays roller coaster and range bound moves from the demand zone of $1.40 to the supply zone of $3. However, the upper neckline of $3 is still not breached and the token faces selling pressure.
Summary
The Waves (WAVES) token sprinkles profit booking and is heading to retest the support zone of $2 near the 100-day EMA mark. Meanwhile, the trend has flipped from bullish to neutral, and indecisiveness between the bulls and bears was witnessed in the recent sessions.
Technical Levels
Support Levels: $2.10 and $2
Resistance Levels: $2.50 and $2.80
Disclaimer
The views and opinions stated by the author or any other person named in this article are for informational purposes only and do not constitute financial, investment, or other advice. Investing in or trading crypto or stocks comes with a risk of financial loss.

Andrew is a blockchain developer who developed his interest in cryptocurrencies while pursuing his post-graduation major in blockchain development. He is a keen observer of details and shares his passion for writing, along with coding. His backend knowledge about blockchain helps him give a unique perspective to his writing skills, and a reliable craft at explaining the concepts such as blockchain programming, languages and token minting. He also frequently shares technical details and performance indicators of ICOs and IDOs.


